 Equal Housing Lender. © 2026 M&T Bank. NMLS #381076. Member FDIC. All rights reserved.
 Equal Housing Lender. © 2026 M&T Bank. NMLS #381076. Member FDIC. All rights reserved.
The U.S. economy continues to defy gravity. Expectations for a meager year of growth have been blown away. The overwhelming consensus to start the year was that the U.S. economy would be in a recession by now. Instead, we just wrapped up what is likely to have been the strongest quarter for economic activity since the end of 2021. We upgraded our base case for the economy several months ago when we reduced our mild recession probability and shifted to a “soft landing.” Now we are further upgrading the economic outlook, though with a twist. The soft-landing scenario remains our base case, but we currently see higher risks of the so-called “no landing” scenario. A no-landing would see stronger U.S. growth in the short term, but it increases the risk that the pressures of higher rates will build and result in a harder landing down the road. What is driving the stronger growth, why do we still see it as more likely to slow into the end of the year, and what does it mean for portfolios?
“Flight attendants, prepare for landing.”
The current economic environment is reminiscent of a flight we recently took to New York’s Long Island. We were on a small plane, and there was significant turbulence. As we descended for our landing, we could feel the wind rocking the plane back and forth. We approached the tarmac, but at the last minute, the pilot aborted the landing and took the plane back into the air. We fly quite a bit, but that was an unsettling experience, to say the least.
Today’s economy is similar to that flight. At the beginning of this year, the effects of the Fed’s rapid policy tightening were anticipated to slow the economy significantly. Economists and strategists hotly debated whether that economic landing would be “hard,” leading to a mild recession with a couple of quarters of negative growth and a modest increase in the unemployment rate of about 2%, or “soft,” meaning a significant slowing of activity but continued expansion of the economy. Over the summer, we upgraded our probability of the soft landing, making it our base case that the U.S. economy would avoid recession.
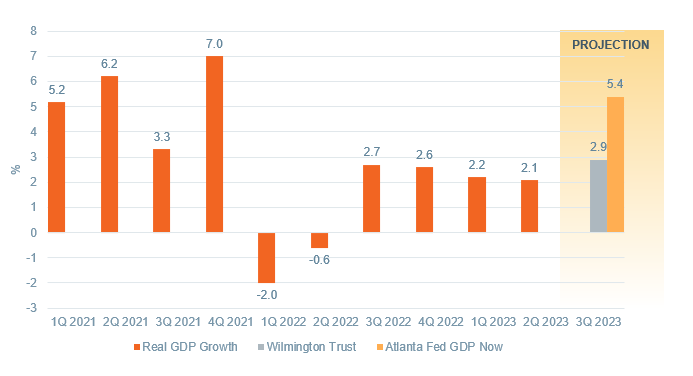
Figure 1: Expecting a reacceleration in GDP in 3Q 2023

Data as of June 30, 2023. Source: Bloomberg, Bureau of Economic Analysis (BEA), and WTIA.
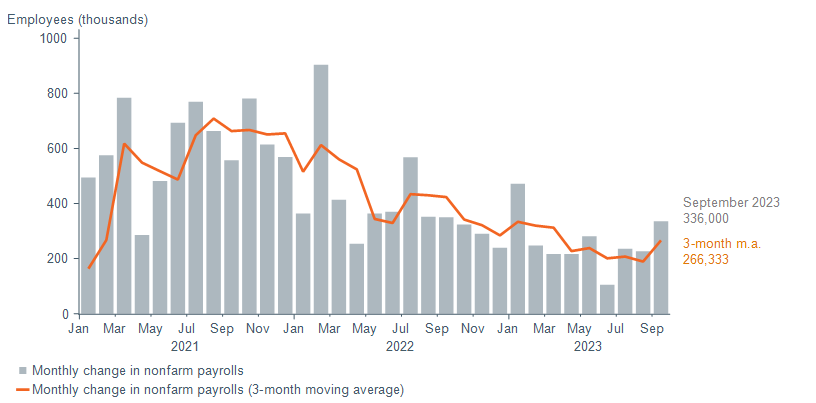
Now, as we move through the fourth quarter, a third scenario is looking more likely. Instead of the economy coming in for the landing, it could reascend. Third-quarter GDP, by the Atlanta Fed’s model, is estimated to be 5.4%. This is likely too high, but even trimming it by the average historical error, it would be the strongest growth we have seen since the initial COVID recovery. We expect 2.9% when it is released next week. Bloomberg consensus estimates for 2023 GDP growth have been upgraded from 0.3% to 2.1%. The labor market also surprised to the upside of late, with 336,000 jobs added in September, the highest since January and a reacceleration from a summer slowdown (Figure 2). “Resilient” is the buzz word being attributed to the surprising spending power of the U.S. consumer, powered by those jobs and still-positive wage gains.
Figure 2: Job growth reaccelerating

Data as of September 30, 2023. Sources: Macrobond, and Bureau of Labor Statistics.
However, like the flight mentioned above, the only thing more unnerving than a bumpy landing is no landing at all. In this no-landing scenario, to which we today place roughly 25% odds, the above-trend economic growth keeps the risk of reaccelerating inflation on the front burner. A tight labor market threatens to push wages higher, which may ultimately need to be passed through to end prices, absent a surge in productivity. The Fed would be more inclined to maintain a higher-for-longer policy stance. Instead of cutting rates by mid-2024, continued stronger-than-expected economic growth could lead the Fed to err on the side of keeping rates elevated through next year. The near-term burst of economic activity increases the risk of a harder landing further down the road, as the lagged effects of higher rates weigh on consumers, small businesses, and the real estate market.
Tempering the no-landing risks
Despite increasing the odds of continued economic strength in a no-landing scenario, we still see it as more likely that the U.S. economy slows into the end of the year. In this soft-landing scenario, to which we place approximately 50% odds, we see growth stalling in the fourth quarter, as payback for the unusual strength in the third quarter. We expect growth to pick up modestly in 2024 to a below-trend growth rate of 1.2% for the year. Crucially for the wage outlook, the strong hiring activity by U.S. firms has been met by even stronger labor force growth, so as those jobs have been filled, wage growth has continued to slow.
Several headwinds are building that we expect to slow but not halt the pace of consumer spending. Consumer savings have been drawn down through the year and are well below trend for much of the population—though data suggest it still remains in aggregate meaningfully above prepandemic levels due to higher income groups. Resumption of student loan payments and higher gasoline prices could weigh on lower-income consumers. Credit card borrowing rates are at an all-time high, and data show payments on balances declining and delinquencies rising, the latter from very low levels. Housing affordability, for renters and owners, is the lowest in decades. Labor strikes and a possible government shutdown pose short-term risks.
These headwinds could certainly weigh on the economy more heavily than we expect, resulting in a mild recession. However, a tight labor market keeps the odds of a recession in check. The manufacturing economy—domestically and globally—has been in decline for the better part of this year but is showing signs of bottoming. Even with the strong third-quarter growth, inflation continues to decelerate. Housing market data suggest the inflationary pressure from owners’ equivalent rent will continue to recede, while purchasing managers indices for services and manufacturing show significant disinflation in the pipeline. If inflation continues to fall, we believe the Fed should be in a position to cut rates even with strong economic growth. We experienced economic growth of 2%–2.5% between 2015 and 2019 without inflation building. In addition, if inflation continues to decline as we expect, the Fed risks yet another misstep as policy will become unnecessarily tight, unless it begins to cut rates.
Market impact
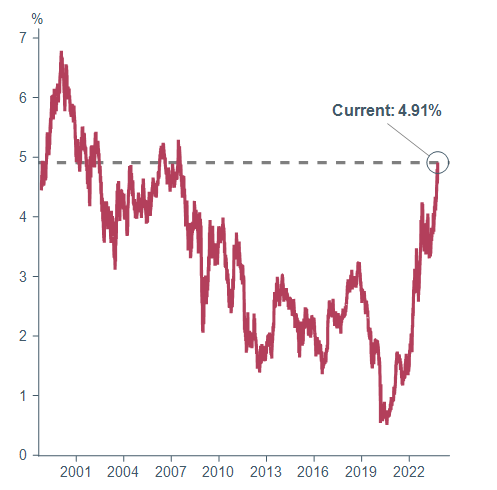
The shift in the balance of economic risks is translating into higher interest rates. We see this reflected in recent market activity, as the 10-year Treasury yield climbs toward 5%—the highest since 2007. The more resilient economic activity has driven real rates higher. The supply/demand backdrop has also deteriorated alongside increased federal borrowing and fewer willing buyers (e.g., the Fed continuing quantitative tightening, as well as reduced demand from international investors).
Figure 3: 10-year Treasury yield surges toward 5%
Current yield on 10-year U.S. Treasury note

Data as of October 18, 2023. Source: Bloomberg.
Past performance cannot guarantee future results.
A higher-for-longer rate environment poses the greatest risk to the poles of the U.S. equity market: the largest, most expensive tech companies, as well as the smallest, most debt-dependent businesses. We have been underweight to U.S. small-cap equities, as measured by the Russell 2000 Index, since the start of the year on the view that higher rates and recession risks would weigh more on this asset class, and indeed U.S. small cap has underperformed U.S. large cap, as measured by the Russell 1000 Index, by 14% so far this year. Within U.S. large cap, where we are currently neutral versus our long-term strategic asset allocation, we are focused on higher-quality companies generating strong profits with solid balance sheets. The quality factor has outperformed the market year to date.
Fixed income remains one of the most attractive asset classes based on our scenario outlook. Despite the recent stretch of difficult performance for investment-grade fixed income, current yields offer an attractive proposition for a long-term investor. Given where yields on investment-grade fixed income sit today, a further moderate increase in interest rates of 50 basis points, or bps (0.50%), would still allow investors to realize a positive total return over a 12-month investment horizon. What we think is more likely is that rates fall from here, and a 50–100 bps decline in rates could result in double-digit returns for investment-grade bonds. (For more, see our recent blog posts covering opportunities in the taxable and municipal bond markets.)
Core narrative
Our economic base case remains for a soft landing, but we recognize the increasing risk that a stronger economy leads to interest rates remaining higher for longer than many expected. Yields of 5%–6% on safe assets like cash and Treasuries create steep competition for equities, and we are currently favoring cash and investment-grade fixed income over equities in our tactical asset allocation. Our underweight to equities comes from a less favorable outlook for U.S. small cap and international developed equities, and we remain neutral to U.S. large cap and emerging markets equities. We are continually assessing opportunities to deploy some of our excess cash into the market, where continued volatility could make both equities and fixed income increasingly attractive.
Definitions
Basis points refers to a common unit of measure for interest rates and other percentages in finance. One basis point is equal to 1/100th of 1%, or 0.01%.
The Russell 1000 Index represents the top 1000 companies by market capitalization in the United States.
The Russell 2000 Index refers to a stock market index that measures the performance of the 2,000 smaller companies.
Facts and views presented in this report have not been reviewed by, and may not reflect information known to, professionals in other business areas of Wilmington Trust or M&T Bank who may provide or seek to provide financial services to entities referred to in this report. M&T Bank and Wilmington Trust have established information barriers between their various business groups. As a result, M&T Bank and Wilmington Trust do not disclose certain client relationships with, or compensation received from, such entities in their reports.
The information on Wilmington Wire has been obtained from sources believed to be reliable, but its accuracy and completeness are not guaranteed. The opinions, estimates, and projections constitute the judgment of Wilmington Trust and are subject to change without notice. This commentary is for informational purposes only and is not intended as an offer or solicitation for the sale of any financial product or service or a recommendation or determination that any investment strategy is suitable for a specific investor. Investors should seek financial advice regarding the suitability of any investment strategy based on the investor’s objectives, financial situation, and particular needs. Diversification does not ensure a profit or guarantee against a loss. There is no assurance that any investment strategy will succeed.
Past performance cannot guarantee future results. Investing involves risk and you may incur a profit or a loss.
Indexes are not available for direct investment. Investment in a security or strategy designed to replicate the performance of an index will incur expenses such as management fees and transaction costs which will reduce returns.
Reference to the company names mentioned in this blog is merely for explaining the market view and should not be construed as investment advice or investment recommendations of those companies. Third party trademarks and brands are the property of their respective owners.
The gold industry can be significantly affected by international monetary and political developments as well as supply and demand for gold and operational costs associated with mining.
Stay Informed
Subscribe
Ideas, analysis, and perspectives to help you make your next move with confidence.
What can we help you with today