

Increasing Tax-free Yields and Favorable Market Dynamics for Municipals: Is it time to increase your allocation?
October 16, 2023
 Equal Housing Lender. © 2026 M&T Bank. NMLS #381076. Member FDIC. All rights reserved.
The municipal market has been undergoing volatility throughout the year, which increased in September and August to where tax-exempt yields on both investment-grade and high-yield municipals represent value, in our view—especially for investors who are looking to lock in attractive levels of tax-free income. In municipals, we believe income is the most important component of returns due to its tax-free nature.
Additionally, as our September 8 Wilmington Wire blog post (“The Current Outlook for a Short-Duration, High-Quality Bond Portfolio”) pointed out, the dynamics are favorable now for building a high-quality bond portfolio. In our opinion, the same is true with tax-exempt municipal bond portfolios.
Several market forces have caused yields to move higher including:
The result is that municipal yields for those seeking tax-free income are approaching historically high levels not seen since the height of the selloff in bonds since November 2022 (Figure 1) and the global financial crisis in 2008. Importantly, current yield levels are well over their 20-year long-term average for municipals at 4.39% today versus the 20-year average of 2.95%.
Figure 1
Bloomberg Municipal Bond Index Yield to Worst
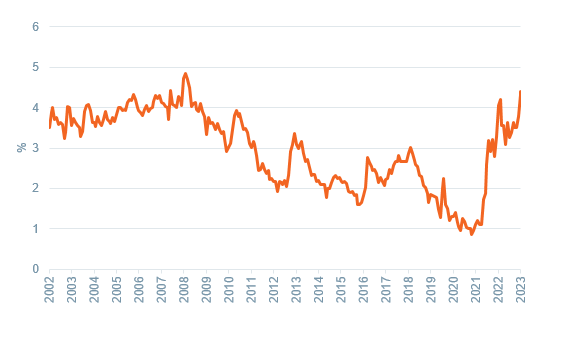
Data as of October 3, 2023. Source Bloomberg.
Note: The Bloomberg Municipal Bond Index is an unmanaged index representing the investment-grade tax-exempt municipal bond universe with a minimum BBB-/Baa rating. The yield to worst is the minimum yield that can be received on a bond after taking into consideration all possible scenarios where the bond could be retired before maturity (i.e., calls, puts, prepayments).
For an investor in the top personal income bracket, the taxable equivalent yield is 7.23%—which means the interest earned on the municipal bond at 4.27% is equivalent to buying a taxable bond yielding 7.23%. The taxable equivalent yield is even more attractive if the interest on the purchased bond is also tax-exempt in the state where the investor resides and/or pays taxes.
Additionally, we believe the current market environment is favorably positioned for long-term municipals—especially if and when the Fed reverses course. Currently, the municipal curve is inverted for the first time since 1966. Similar to the inversion in the Treasury curve, short-term yields are slightly higher than intermediate yields as measured by the 2-10-year yield curve (see chart below). Importantly, the municipal curve is rarely inverted mainly due to the constant imbalance between demand and supply in the asset class.
Figure 2
Municipal Yield Curve: 1964-2023-Current -9 basis points (bps)*
Curve Stayed Inverted for the First Time Since September 1966
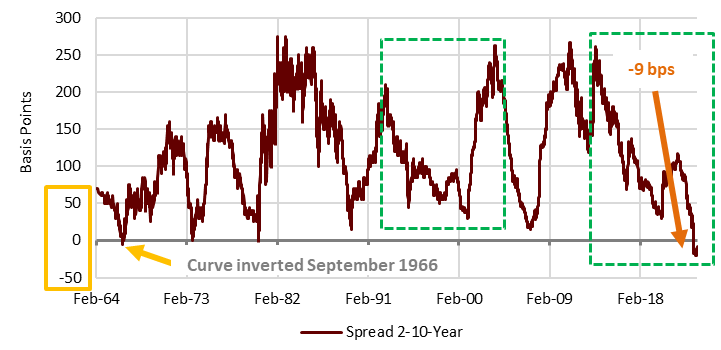
* Basis points refers to a common unit of measure for interest rates and other percentages in finance. One basis point is equal to 1/100th of 1%, or 0.01%.
Data as of September 28, 2023. Source Municipal Market Advisors, LLC.
Past performance cannot guarantee future results. Indices are not available for direct investment. Investment in a security or strategy designed to replicate the performance of an index will incur expenses such as management fees and transaction costs which will reduce returns. There is no assurance that any investment strategy will be successful.
Research into the previous hiking cycles by Municipal Market Advisors (MMA) (a research firm focused on municipals) indicates that when the Fed pauses or begins to cut, municipals generally perform well over the next 12 months. The chart below illustrates the positive returns across all maturities and credit quality one year after the last hike (the average is between 6% and 10% returns).
The reason for this performance typically is that short-term yields decrease (bond prices increase) and long-term yields increase (bond prices decrease). While the returns are all positive, in most municipal yield curve scenarios, including today, the better after-tax return/yield per unit of risk is in the intermediate section of the yield curve (10–15-year maturities) as most long-term municipal bonds are issued with 10-year par call features (i.e., the issuer retains the right to call the bond after 10 years) and so price appreciation is limited by the par call (the date a callable bond can be redeemed for a specific call price before its maturity date).
Figure 3
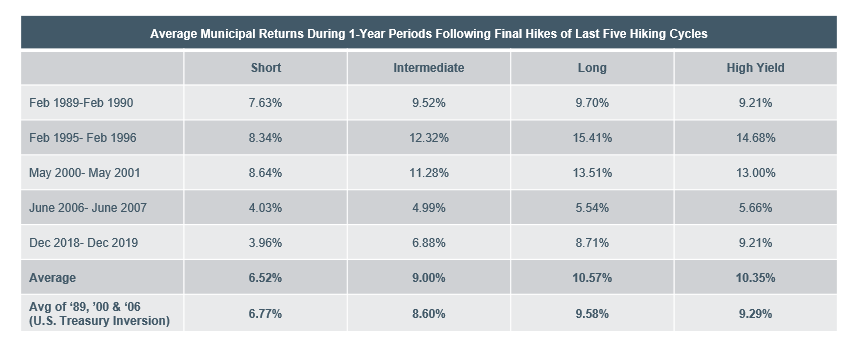
Data as of September 30, 2023. Source Municipal Market Advisors, LLC. Returns are represented by the following Vanguard municipal funds (VMLTX, VWITX, VWLTX, VWAHX) during the one-year period.
Performance shown represents past performance and cannot guarantee future results.
Short term performance may not be indicative of long term results.
Average annual total returns & fund expenses (%) as of 9/30/2023 for the Vanguard municipal funds (VMLTX, VWITX, VWLTX, VWAHX):
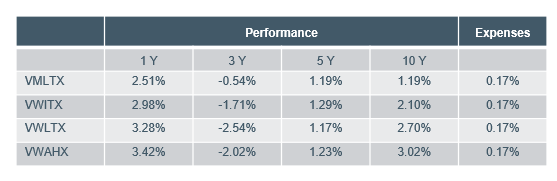
Performance shown represents past performance and cannot guarantee future results.
Source: Vanguard.
Given current conditions and the record amount of cash invested in both money market and Treasury bills, we think it’s prudent for investors to put fresh money to work in portfolios, which may lock in these attractive levels of tax-free income. Municipal investors can mitigate against the reinvestment risk of declining cash yields and the difficulty in timing the declines. We do know from history that markets tend to move in anticipation months before an actual decision by the Fed. (Please keep in mind that these are general guidelines; contact your advisor to see whether the approach we described above is appropriate for your particular portfolio and circumstances.)
Core narrative
If we are in a higher for longer environment, municipal investors will continue to receive a favorable after-tax yield and, if the Fed reduces rates beginning in 2024, municipal investors may likely benefit from the bull bond market and receive favorable returns. In either scenario, we think it could be a win-win for investors. We currently hold an overweight to investment-grade fixed income, a slight underweight to equities, and a slight overweight to cash that we look to deploy opportunistically.
[1] Source: J.P. Morgan. Data as of September 27, 2023.
Facts and views presented in this report have not been reviewed by, and may not reflect information known to, professionals in other business areas of Wilmington Trust or M&T Bank who may provide or seek to provide financial services to entities referred to in this report. M&T Bank and Wilmington Trust have established information barriers between their various business groups. As a result, M&T Bank and Wilmington Trust do not disclose certain client relationships with, or compensation received from, such entities in their reports.
The information on Wilmington Wire has been obtained from sources believed to be reliable, but its accuracy and completeness are not guaranteed. The opinions, estimates, and projections constitute the judgment of Wilmington Trust and are subject to change without notice. This commentary is for informational purposes only and is not intended as an offer or solicitation for the sale of any financial product or service or a recommendation or determination that any investment strategy is suitable for a specific investor. Investors should seek financial advice regarding the suitability of any investment strategy based on the investor’s objectives, financial situation, and particular needs. Diversification does not ensure a profit or guarantee against a loss. There is no assurance that any investment strategy will succeed.
Past performance cannot guarantee future results. Investing involves risk and you may incur a profit or a loss.
Indexes are not available for direct investment. Investment in a security or strategy designed to replicate the performance of an index will incur expenses such as management fees and transaction costs which will reduce returns.
Reference to the company names mentioned in this blog is merely for explaining the market view and should not be construed as investment advice or investment recommendations of those companies. Third party trademarks and brands are the property of their respective owners.
The gold industry can be significantly affected by international monetary and political developments as well as supply and demand for gold and operational costs associated with mining.
Stay Informed
Subscribe
Ideas, analysis, and perspectives to help you make your next move with confidence.
What can we help you with today