

The Current Outlook for a Short-Duration, High-Quality Bond Portfolio
September 8, 2023
 Equal Housing Lender. © 2026 M&T Bank. NMLS #381076. Member FDIC. All rights reserved.
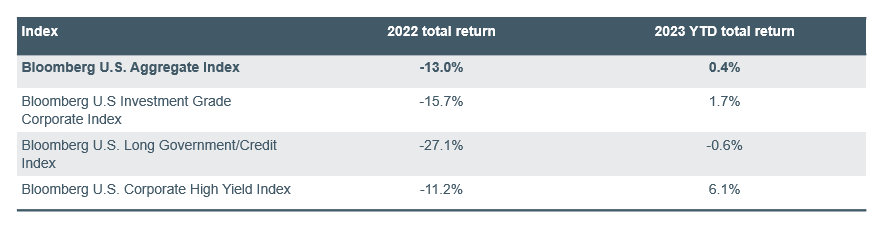
Fixed Income markets have struggled mightily coming out of the pandemic, especially since early 2022. The highest inflation in a generation has slowed but remains persistent and the Fed has reacted with a rapid tightening cycle that led to historically negative returns across the asset class. As seen in the chart below, fixed income returns were negative across all fixed income markets during 2022. The Bloomberg U.S. Aggregate Index—the broadest measure of the U.S. investment-grade fixed income market—generated a -13.0% total return in 2022. While inflation is still too high and Chair Powell continues his hawkish rhetoric, we believe the Fed is nearing the end of its tightening cycle. Perhaps more important for fixed income investors is today’s higher rate environment offers cushion even if rates move higher, making the asset class attractive, in our view.
Source: Bloomberg. Data as of August 25, 2023.
Investing involves risks, and you may incur a profit or a loss. Past performance cannot guarantee future results. Indices are not available for direct investment. Investment in a security or strategy designed to replicate the performance of an index will incur expenses such as management fees and transaction costs which will reduce returns. There is no assurance that any investment strategy will be successful.
First the bad news: the -13.0% loss for the broad U.S. fixed income market was by far the worst annual return in more than two decades. In fact, since 2000, the Aggregate Index only posted a negative total return in two other years: 2013 and 2021 posted -2.02% and -1.54% returns, respectively. Although certainly a painful experience for fixed income investors, there is some good news. First, the losses experienced in 2022 where securities have not been sold are unrealized. Assuming no defaults—which are extremely rare in investment-grade portfolios—individual bonds in the portfolio will accrete to par at maturity.
Even more encouraging are the expected returns for newly constructed fixed income portfolios moving forward in today’s higher rate environment. Those higher rates generate more income, making it a larger component of total fixed income returns, and provide more yield protection to cushion against further increases in rates. Investors have already experienced this cushion so far in 2023, with mostly positive returns across fixed income markets despite higher interest rates this year and a Federal Reserve that has continued to increase its benchmark rate.
U.S. Treasury yield curves
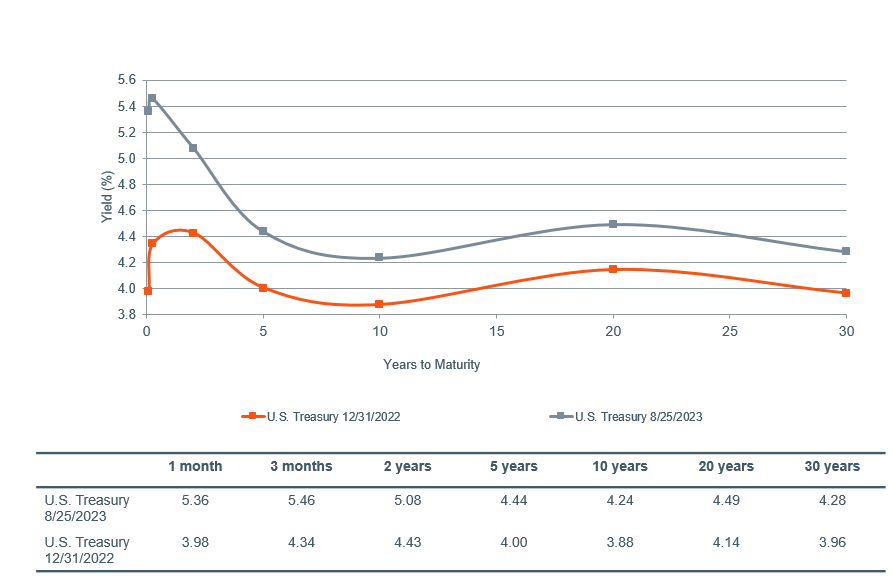
Source: Bloomberg. Data as of August 25, 2023.
Return outlook
The outlook for total returns from here is now quite attractive, in our view, and best illustrated through example. Below are market characteristics for two fixed income indices utilized as benchmarks for client portfolios. They differ by duration, one short and one intermediate. Both portfolios are very high quality with a mix of U.S. Treasuries, federal agency debt, and investment-grade corporate bonds. Both have a current yield to worst above 5%. The ultra-short portfolio has an overall duration of 1.3 years, and any individual security has a maximum maturity of three years. The intermediate portfolio has a duration of approximately 3.5 years and a maximum maturity of 10 years.
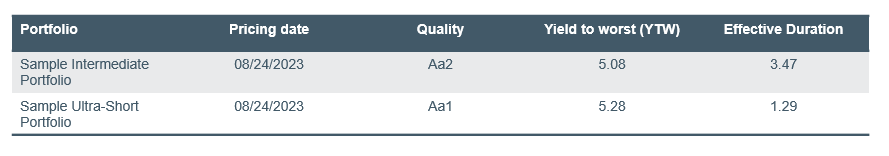
Source: Bondedge and Wilmington Trust Investment Advisors. Data as of August 24, 2023.
Sample portfolios are simulated in Bondedge, which uses a range of assets classes to analyze holdings, distributions of both fixed income and multi-asset class portfolios. This also includes term structure and prepayment models, as well as cash flow. The sample Intermediate portfolio is represented by the Bloomberg Intermediate Government Credit Index. The sample Ultra-Short portfolio is represented by the 1-3 year ICE BOA U.S. Treasury Index.
Now let’s look at how expected returns over a 1-year time horizon are affected by changes in interest rates. First, we run a simulation for the intermediate portfolio showing how total returns are affected by upward or downward parallel shifts across the U.S. Treasury curve. As shown in the table below, total return remains positive even if rates move up by 50 basis points, or bps (0.50%), over the next 12 months. In fact, total return does not turn negative on this portfolio until the yield curve shifts upward by approximately 150bps. This outcome is far removed from consensus or Wilmington Trust’s expectation for rates over the next 12 months. If, by contrast, the Fed lowers rates in 2024 as many expect, total return on this portfolio could range from 7% to mid-teens. The durability of positive returns in the face of rising rates is due to the income component.
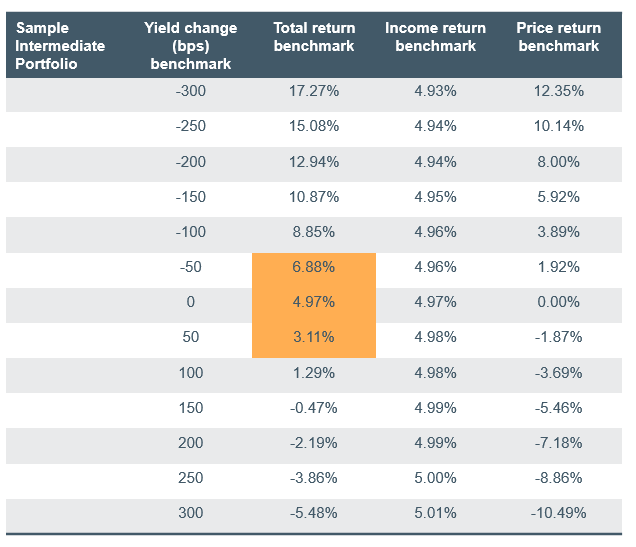
Source: Bondedge and Wilmington Trust Investment Advisors. Data as of August 24, 2023.
The sample Intermediate portfolio is represented by the Bloomberg Intermediate Government Credit Index.
Past performance cannot guarantee future results. Indices are not available for direct investment. Investment in a security or strategy designed to replicate the performance of an index will incur expenses such as management fees and transaction costs which will reduce returns. There is no assurance that any investment strategy will be successful.
Under the same set of assumptions, the ultra-short portfolio exhibits a similar yet even stronger dynamic, due to the shorter duration. For example, this portfolio would be expected to return between 4.2% and 6.0% should rates increase or decrease by 50bps over the next 12 months. In fact, returns would remain over 1.7% under the highly unlikely scenario that rates increase another 200bps. This reflects the shorter duration of this portfolio and the even larger impact that income has on total return.
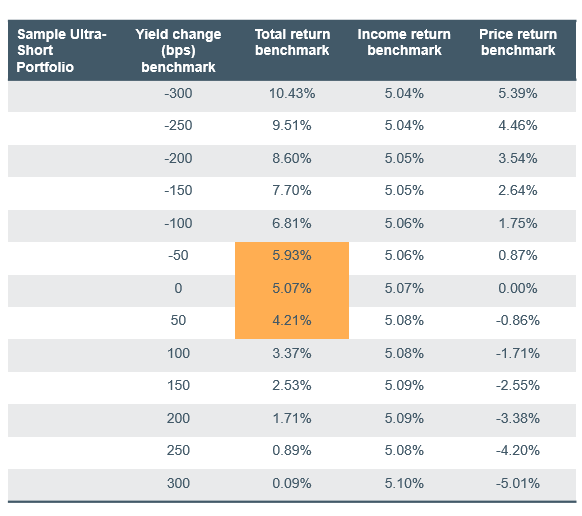
Source: Bondedge and Wilmington Trust Investment Advisors. Data as of August 24, 2023.
The sample Ultra-Short portfolio is represented by the 1-3 year ICE BOA U.S. Treasury Index.
Past performance cannot guarantee future results. Indices are not available for direct investment. Investment in a security or strategy designed to replicate the performance of an index will incur expenses such as management fees and transaction costs which will reduce returns. There is no assurance that any investment strategy will be successful.
For taxable investors, we must evaluate the application of these concepts to the municipal market. Broadly speaking, we believe that munis are now set up to experience similar positive returns as taxable portfolios. Yields relative to taxable alternatives are fairly attractive. The taxable equivalent yield (TEY) at 3.55% tax-exempt for an AAA-rated municipal with a five-year maturity in the below sample portfolio is 6% for an investor in the higher personal income tax bracket. Additionally, supply is down so far by an estimated 20% year to date over last year—which is supportive of existing municipal yields since the demand is historically strong for tax-exempt municipal paper as investors seek tax-free income. A large segment of the demand for municipals comes from individuals who typically reinvest their maturities and coupons—which also provides a ready source of new monies to invest. If the market is at the top of or near the end of the rate hiking cycle, the current environment is favorable to those investors looking to lock in income.
As the example below illustrates, if the average coupon (4.40%) is constant, any reduction in rates will increase total returns (as coupon income is constant); and, if there is an increase in rates, the income portion of the return can help stabilize returns. If rates stay constant or increase, the continued reinvestment of cash flows (calls, maturities, coupons) can be reinvested at higher yield levels. It is important to note that since income is the federally tax-free portion of the return—and is the reason most investors are in tax-exempt municipals—as yields rise, portfolios should generate more income.
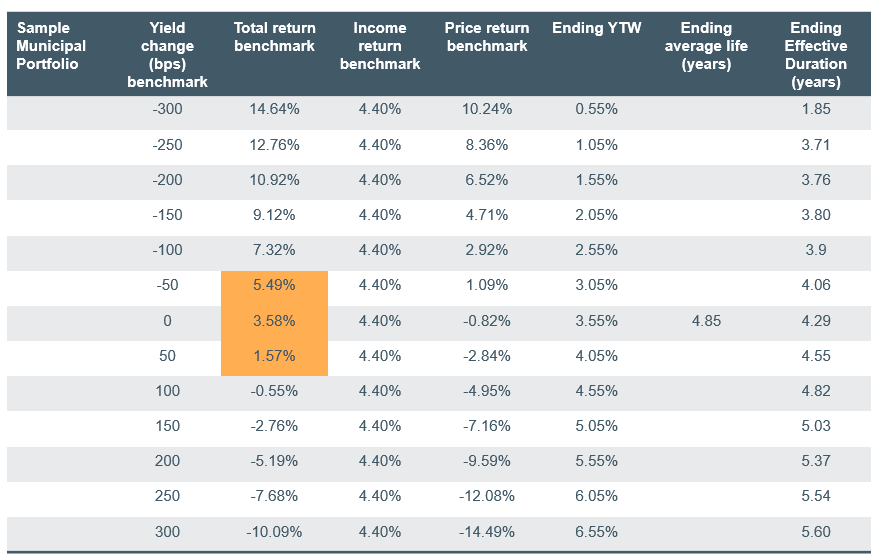
Source: Bondedge and Wilmington Trust Investment Advisors. Data as of August 24, 2023.
The sample Municipal portfolio is represented by the S&P 500 Municipal Bond Index.
Past performance cannot guarantee future results. Indices are not available for direct investment. Investment in a security or strategy designed to replicate the performance of an index will incur expenses such as management fees and transaction costs which will reduce returns. There is no assurance that any investment strategy will be successful.
Core narrative
In summary, although the above scenario analysis is simplistic and does not factor in changes in credit spreads or changes in the shape of the Treasury curve, it does highlight the favorable return characteristics of a short-duration, high-quality bond portfolio in the current market environment. This offers cushion against further upward movements in rates, making the asset class attractive even with some uncertainty remaining regarding the path of inflation and Fed policy. We currently hold an overweight to investment-grade fixed income, a slight underweight to equities, and a slight overweight to cash that we look to deploy opportunistically.
Index Descriptions
1-3 year ICE BOA U.S. Treasury Index is market value weighted and is designed to measure the performance of U.S. dollar-denominated, fixed rate securities with minimum term to maturity greater than one year and less than or equal to three years.
The Bloomberg U.S. Aggregate Index measures the performance of the entire U.S. market of taxable, fixed-rate, investment-grade bonds. Each issue in the index has at least one year left until maturity and an outstanding par value of at least $250 million.
The Bloomberg U.S Investment Grade Corporate Index measures the investment grade, fixed-rate, taxable corporate bond market.
The Bloomberg Intermediate US Government/Credit Bond Index is a broad-based flagship benchmark that measures the non-securitized component of the US Aggregate Index with less than 10 years to maturity.
The Bloomberg U.S. Long Government/Credit Index measures the performance of the non-securitized component of the U.S. Aggregate Index with maturities of 10 years and greater, including Treasuries, government-related issues, and corporates.
The Bloomberg U.S. Corporate High Yield Index measures the performance of taxable, fixed-rate bonds issued by industrial, utility, and financial companies and rated below investment grade. Each issue in the index has at least one year left until maturity and an outstanding par value of at least $150 million.
The S&P Municipal Bond Index is a broad, market value-weighted index that seeks to measure the performance of the U.S. municipal bond market.
Definitions
Basis points refers to a common unit of measure for interest rates and other percentages in finance. One basis point is equal to 1/100th of 1%, or 0.01%, or 0.0001, and is used to denote the percentage change in a financial instrument.
Call risk: Call risk is the possibility that an issuer may redeem a fixed income security before maturity (a call) at a price below its current market price. An increase in the likelihood of a call may reduce the security’s price.
Coupon: The annual interest rate paid on a bond, expressed as a percentage of the face value and paid from issue date until maturity.
Credit risk: Fixed income securities carry the risk of default, which means that the security issuer fails to pay interest or principal when due. Many fixed income securities receive credit ratings from services such as Standard & Poor’s and Moody’s Investor Services, Inc. These services assign ratings to securities by assessing the likelihood of issuer default. Lower credit ratings correspond to higher credit risk.
Effective Duration: A duration calculation for bonds that have embedded options. This measure of duration takes into account the fact that expected cash flows will fluctuate as interest rates change and is, therefore, a measure of risk.
Interest rate risk: Prices of fixed income securities rise and fall in response to changes in the interest rate paid by similar securities. Generally, when interest rates rise, prices of fixed income securities fall. However, market factors, such as the demand for particular fixed income securities, may cause the price of certain fixed income securities to fall while the price of other securities rise or remain unchanged. Interest rate changes have a greater effect on the price of fixed income securities with longer durations. Duration measures the price sensitivity of a fixed income security to changes in interest rates.
Yield to worst: A measure of the lowest possible yield that can be received on a bond with an early retirement provision.
Facts and views presented in this report have not been reviewed by, and may not reflect information known to, professionals in other business areas of Wilmington Trust or M&T Bank who may provide or seek to provide financial services to entities referred to in this report. M&T Bank and Wilmington Trust have established information barriers between their various business groups. As a result, M&T Bank and Wilmington Trust do not disclose certain client relationships with, or compensation received from, such entities in their reports.
The information on Wilmington Wire has been obtained from sources believed to be reliable, but its accuracy and completeness are not guaranteed. The opinions, estimates, and projections constitute the judgment of Wilmington Trust and are subject to change without notice. This commentary is for informational purposes only and is not intended as an offer or solicitation for the sale of any financial product or service or a recommendation or determination that any investment strategy is suitable for a specific investor. Investors should seek financial advice regarding the suitability of any investment strategy based on the investor’s objectives, financial situation, and particular needs. Diversification does not ensure a profit or guarantee against a loss. There is no assurance that any investment strategy will succeed.
Past performance cannot guarantee future results. Investing involves risk and you may incur a profit or a loss.
Indexes are not available for direct investment. Investment in a security or strategy designed to replicate the performance of an index will incur expenses such as management fees and transaction costs which will reduce returns.
Reference to the company names mentioned in this blog is merely for explaining the market view and should not be construed as investment advice or investment recommendations of those companies. Third party trademarks and brands are the property of their respective owners.
The gold industry can be significantly affected by international monetary and political developments as well as supply and demand for gold and operational costs associated with mining.
Stay Informed
Subscribe
Ideas, analysis, and perspectives to help you make your next move with confidence.
What can we help you with today