 Equal Housing Lender. © 2026 M&T Bank. NMLS #381076. Member FDIC. All rights reserved.
 Equal Housing Lender. © 2026 M&T Bank. NMLS #381076. Member FDIC. All rights reserved.
Having rounded the halfway mark of the year, we head into the back half with solid optimism on the economy and equity markets. Recession odds are very low, inflation is on the descent, and the Fed will soon embark on a rate cut cycle. The first six months delivered a stellar 15% return for the S&P 500—a feat that was mainly attributable to just a few of the largest names and is unlikely to be repeated in the second half of the year. Below, I dig deeper into what we got right in the first half and what we expect to unfold in the remainder of the year. In short, we view the easing of monetary policy and ongoing economic cycle as opportunities for equity market leadership to broaden and the bull market to continue, if not with more modest index returns over the next 12 months than we experienced in the prior 12 months. We recently added to our U.S. equity overweight, focusing on higher-quality strategies in U.S. large and small cap. This increase in our U.S. equity position was funded by trimming fixed income and international developed equities. We now hold an underweight to cash and hedge funds (or, in some portfolios, liquid alternatives).
First half recap
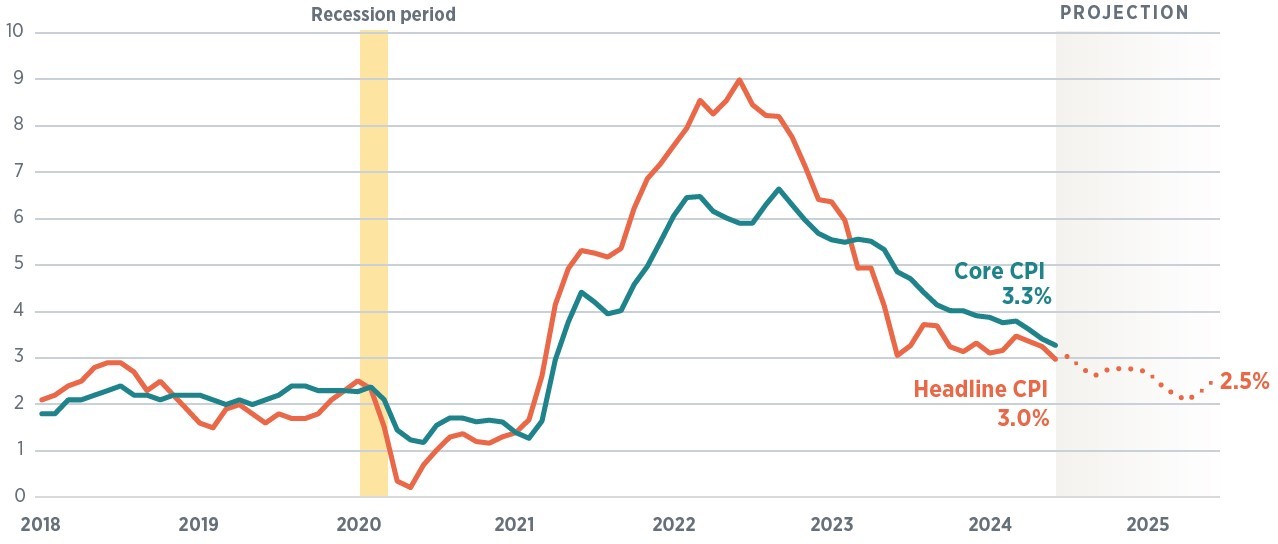
Our 2024 Capital Markets Forecast called for a continuation of U.S. economic exceptionalism, with U.S. equities expected to continue leading the pack, and that is exactly what has transpired. Most critical to our optimistic call on the economy has been our expectation that inflation would continue to move lower as the labor market maintains its strength. Despite a stalling of headline inflation in the first quarter—in our view, largely due to seasonal distortions in the data—the overall disinflation trend is intact and in June showed outright deflation of headline CPI on a month-over-month basis. Indeed, we project that headline CPI will be below 2.5% by the end of the second quarter of 2025 (Figure 1).
Figure 1: Inflation to continue to slow in 2024
Consumer Price Index (CPI) inflation (year-over-year % change)

Data as of 7/11/24. Sources: Bureau of Labor Statistics, WTIA.
We began the year expecting the Fed to start cutting rates in the first quarter, and by a total of 125 basis points, or bps (1.25%) in 2024. The disappointing inflation progress in the first quarter pushed out that timeline, and we now expect the Fed to cut by a total of 50 bps this year starting with its September meeting. Inflation has not yet reached the Fed’s target, but the central bank will need to cut rates before that level is attained in order to avoid the consequences of remaining too tight for too long, namely a recession. In fact, Chair Powell stressed precisely this idea in this month’s semi-annual congressional appearance.
As expected, the U.S. economy remains on solid footing relative to the rest of the world, though it is slowing. At the start of the year, we forecasted GDP growth of 1.3% in 2024, which would be a notable slowdown from the 2.5% growth rate in 2023. After a strong first quarter of economic and consumer activity, we upgraded our GDP forecast for the year to 2.1%. We still expect economic activity to moderate, and are seeing signs of the U.S. consumer becoming more discerning with spending—particularly lower-income consumers who have begun to struggle under the weight of elevated credit card debt. Outside of the U.S., the picture is uninspiring. Though Europe has shown some improvement, its recovery has been weak. The mass exodus of capital out of China has slowed, but the country remains mired in structural issues related to a property bubble, lackluster consumer demand, and aging demographics.
On the markets, we expected U.S. equities to lead the way, but were as surprised as many by the magnitude of the market’s strength and its very narrow leadership. We have been positioning portfolios for a broadening of leadership, something that would mean greater participation from the value factor, cyclical sectors, and small cap. However, through the first half of the year, the U.S. equity market has basically been one big momentum, AI-driven trade. The largest, most AI-exposed companies have done the best, including some data-center real estate investment trusts (REITs) and utilities exposed to AI’s energy use. Small cap barely eked out a positive return for the first half of the year but, since the start of July, jumped over 10% in the aftermath of inflation data that strongly suggest our expectations for Fed rate cuts. We think the outperformance of small cap can continue—particularly as policy rates start to drop—which we expect to benefit the financials overweight within small cap.
We believe the second half of the year will bring a continuation of the major economic trends witnessed in the first half: slowing economic growth and continued disinflation, but low odds of a recession. Most households have spent or invested the massive pile of excess savings accumulated over the pandemic; and lower-income groups are starting to feel the cumulative burden of high borrowing costs and rents. The higher-income consumer is likely to continue to spend, but we do not think companies have nearly the degree of pricing power that they had in the past few years. And absent a supply-side shock, inflation is very unlikely to reaccelerate while consumer demand is moderating.
One of the key ingredients for a continued economic expansion is a healthy labor market. Over the past year, the labor market has been in a process of normalization, with labor supply and demand coming into better balance. According to the Bureau of Labor Statistics, job openings have fallen 33% from the peak, the number of people quitting their jobs for a better, higher-paying alternative has slowed, and new job creation has settled into a more normal rate of 177 per month for the last three months. While these metrics reflect a relatively weaker market than the red-hot jobs market we have seen since the pandemic, there nonetheless remains a healthy bid for new workers.
While we place low odds on the economy entering recession in the next 12 months, we are monitoring some “spider cracks.” Although headline job growth remains sturdy, the decline in labor demand has created challenges on the ground. The number of people looking for work because they lost their previous job is up by more than 200,000 over the past year, a metric that is rarely positive during expansions. At the same time, the number of people who have re-entered the labor force (after a hiatus) but haven’t landed a job yet is also up by more than 200,000, reflecting a more challenging labor market. That environment is elongating the job search, with 38% of unemployed workers on the hunt for at least 15 weeks, the highest since January 2022. The services economy has been very strong this year, but the ISM Services PMI just recently dipped negative in two out of the last three months, a slowing that is raising some eyebrows and could signal a contracting services economy. If the Fed begins cutting rates soon, these spider cracks need not turn into larger fissures. In addition, relief on the interest rate front along with slowing wage growth and input costs will help companies manage profitability and maintain hiring at a more moderate, sustainable pace.
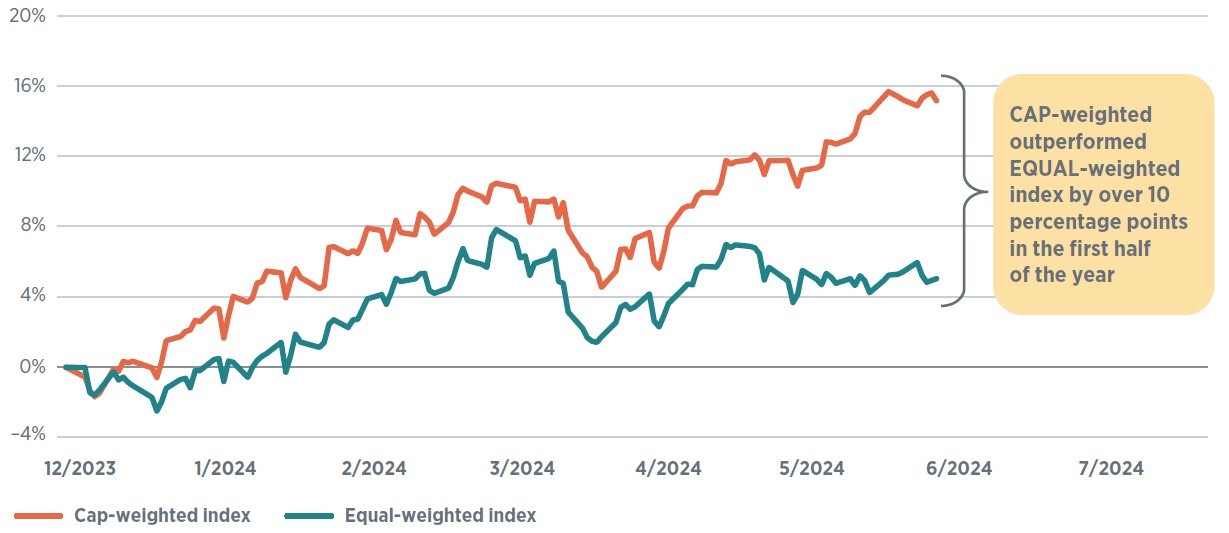
Figure 2: Divergence beneath the surface
Year-to-date returns for cap-weighted and equal-weighted indices (S&P 500)

The cap- and equal-weighted indices are indexed to 0 starting on December 31, 2023.
Sources: Bloomberg, WTIA.
The S&P 5000 index value is calculated based on the market cap of each company, which is equal to the share price of the company multiplied by the total number of shares outstanding. The S&P 500 Equal Weight Index (EWI) is the equal-weighted version of the S&P 500 index. The index includes the same components as the capitalization weighted S&P 500, but each company in the S&P 500 EWI is allocated a fixed weight, or 0.2% of the index total, rebalanced quarterly.
Past performance cannot guarantee future results. Indices are not available for direct investment. Investment in a security or strategy designed to replicate the performance of an index will incur expenses such as management fees and transaction costs which will reduce returns.
History tells us that, given the stretch of strong equity performance since October 2023 and current valuations for the market as a whole, we are due for a bit of a pullback. As mentioned earlier, market leadership has been very narrow, as proxied by the 10 percentage point outperformance of the market-cap-weighted S&P 500 compared to the equal-weighted index (Figure 2). Depending on your outlook, this could be seen as a risk or an opportunity. We certainly appreciate that a selloff in mega-cap tech will make it nearly impossible for the overall index to deliver a positive return. However, we also recognize that valuations for most stocks outside of the largest AI-related names are trading in line with their historical median going back to 2010. These companies tend to be more heavily exposed to cyclical sectors like financials, industrials, and real estate, all of which would benefit from a decline in interest rates and steepening of the yield curve. Rate cuts provide a pathway for the rest of the market to pick up the slack even if mega-cap tech returns moderate, and the market reaction after June’s CPI reading is, in our view, the beginning of a long-awaited rotation of leadership.
Market volatility tends to increase in the lead-up to U.S. presidential elections. However, we do not expect a correction outside of what is normal in a nonrecessionary period. In other words, equities could hit a patch of turbulence, but as long as the economy remains on solid footing, any pullback should be short, shallow, and a buying opportunity for excess cash on the sidelines. Moreover, we typically see markets drift upward following the election regardless of the political makeup of Washington, as clarity allows investors to breathe a sigh of relief. The strong caveat to that view would be the significant fiscal and market uncertainty that would result from the House, the Senate, and the presidency all being controlled by a single party.
Analyzing historical market behavior around elections is challenging given relatively few data points: There have been only 24 elections since 1928, with 16 of them representing an incumbent, and none of those having two incumbents. This election cycle is anything but normal, and we will be dimensioning the key policy issues for markets in a forthcoming piece. In short, we expect globalization and tax policy to rank supreme in the minds of investors, with a bit more white space between the two candidates on the latter issue as opposed to the former. Other key issues include energy policy and regulation. In our view, a divided government would be the best scenario for markets, as the inherent checks and balances are less likely to result in extreme policy changes and could even bring some progress on one of the most pressing long-term issues: the U.S. fiscal debt.
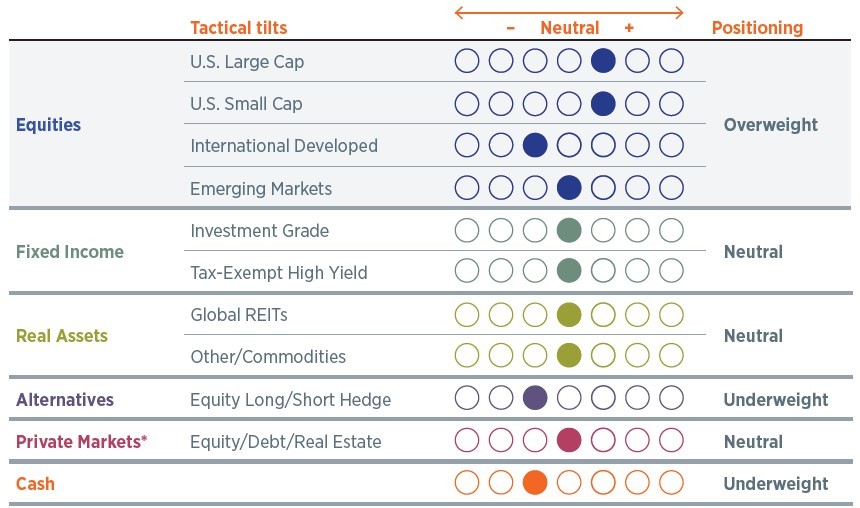
We see the combination of an extended economic cycle, easing monetary policy in the U.S. and globally, as well as reasonable valuations for the majority of stocks as supportive of a continued bull market. Investors should not get used to calendar- year returns in excess of 20%, but we forecast high single-digit returns for equities over the next 12 months. We recently added to our equity overweight, and we favor U.S. over non-U.S. equities (Figure 3). Our U.S. large-cap equity overweight will benefit if current momentum continues, while our modest U.S. small-cap overweight will shine if leadership continues the broadening that we've seen since the start of July.
We expect better relative performance from the “S&P 493” going forward, and our active managers continue to look for compelling stocks outside of the largest names. At the same time, we remain focused on risk management and do not wish clients to miss out if the AI trade continues to dominate, so we are carefully monitoring exposure to the largest names across portfolios and balancing the growth and value factors. Higher-quality companies remain an area of high conviction, as firms generating steady profits with low leverage should continue to benefit in a period of slowing economic growth and elevated rates, particularly in small cap.
Figure 3: Asset class positioning
High-net-worth portfolios with private markets*

* Private markets are only available to investors that meet Securities and Exchange Commission standards and are qualified and accredited. We recommend a strategic allocation to private markets but do not tactically adjust this asset class.
Data as of July 17, 2024.
Positioning reflects our monthly tactical asset allocation (TAA) versus the long-term strategic asset allocation (SAA) benchmark. For an overview of our asset allocation strategies, please see the disclosures.
Investment-grade fixed income is still expected to deliver respectable total returns, and we hold a full allocation compared to our strategic asset allocation benchmark. However, in a period of easing monetary policy and solid economic growth, we expect equities to outperform fixed income. Our recent addition to equities was funded from fixed income. The coming months could deliver some unexpected twists in the market or political cycle. We remain focused on fundamental analysis of the economy and markets as we aim to position our clients for long-term success.
Please see important disclosures at the end of the article.
Stay Informed
Subscribe
Ideas, analysis, and perspectives to help you make your next move with confidence.
What can we help you with today