Equal Housing Lender. © 2026 M&T Bank and its affiliates and subsidiaries. NMLS #381076. M&T Bank Member FDIC.
Institutional Services Insights
Wealth Management Insights
Who We Are
Log In
Select Business Area
Our Services
Institutional Services Insights
What a difference 3 weeks can make. On September 16 the Federal Open Market Committee (FOMC) of the Federal Reserve (Fed) raised the target for their benchmark policy tool by 0.25% to “remove a dose of [monetary] accommodation” from financial conditions and try to rein in inflation. At that time core Personal Consumption Expenditures (PCE) inflation was at 3.3% and looked to be trending higher. The labor market looked strong, with the most recent job growth tally beating all economists’ expectations and coming in three times higher than the median (or “consensus”) forecast. Since then the picture has changed significantly. Inflation data is starkly lower thanks to hefty historical revisions and a weak reading for August. Similarly, jobs data came in low for September and previous readings were revised lower. Additionally, the unemployment rate ticked up for the first time since February. In short, the U.S. economy now looks much less in need of rate hikes than it did just 3 weeks ago.
Simultaneously, the bond market has been turning the screws at the long end of the interest rate curve. At the time of the Fed rate hike the 10-year yield was 5%, the highest in 19 years, and up from 4.6% at the time of the previous meeting in July. Now it has pushed even higher, briefly touching 5.36% on October 7, the highest since 2002. We wrote about the drivers of long-term rates in August, arguing there have been a number of overlapping forces, but not inflation expectations. We update that discussion below.
We see opportunity in the recent rise in rates and have made changes in portfolios. We maintain an optimistic view about the economy as strong enough to avoid recession but not strong enough to generate sustained inflation. Accordingly, we do not expect multiple rate hikes as are currently priced into fixed income markets. Long-term rates are likely to come down in our view, making bonds an attractive tactical position.
Hawkish Fed in September
The Fed rate hike in September was accompanied by updated forecasts from the group. The FOMC comprises 19 officials from the Board of Governors in Washington D.C. and the 12 reserve banks across the country. The group submits forecasts at 4 of the 8 scheduled yearly meetings. However, Chair Warsh is not supportive of “forward guidance” so there are only 18 forecasts.
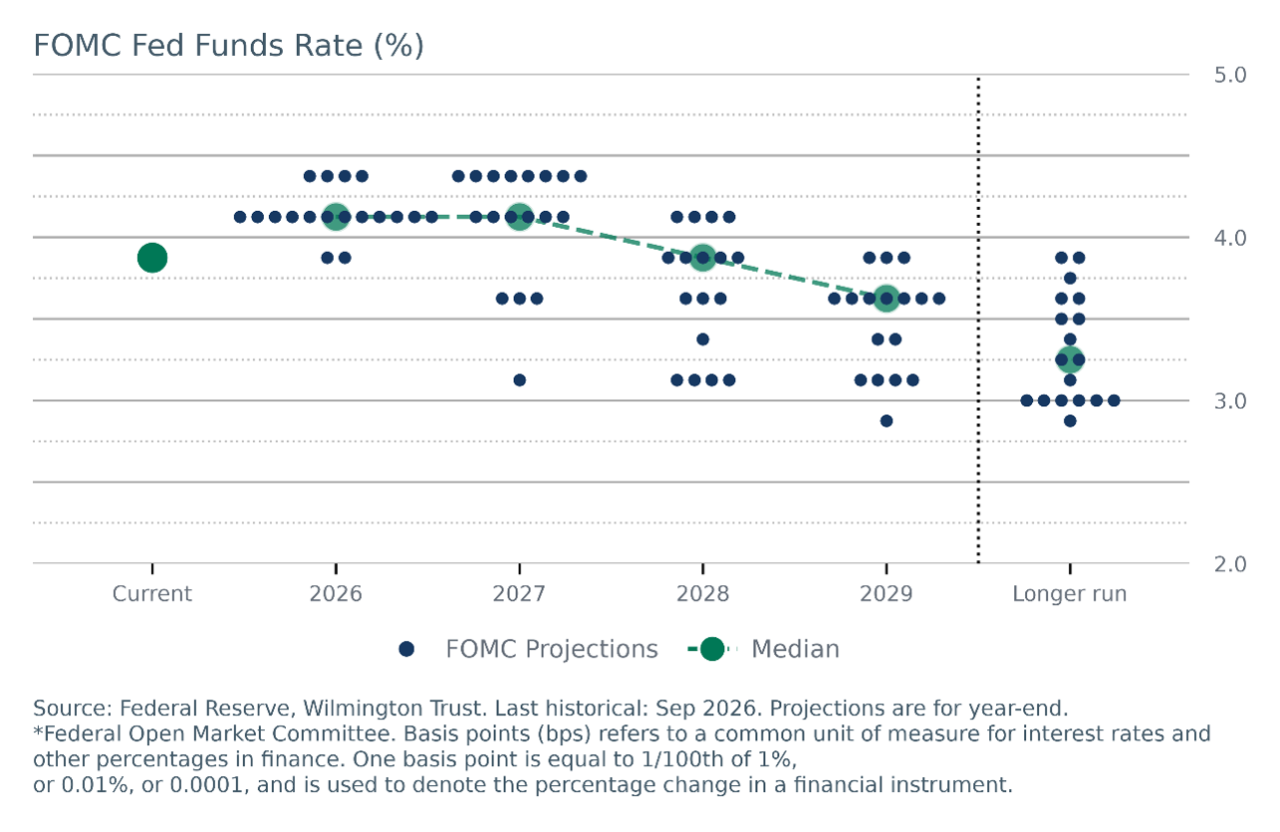
The rate hike in September (to a range of 3.75%-4.0%) was accompanied by forecasts revealing that 16 of the 18 officials thought at least one more rate hike of 0.25% in 2026 would be appropriate (Figure 1). That would be a 0.75% swing to the high side compared to where the committee stood at the start of the year when the median forecaster was expecting a 0.25% reduction in 2026, quite a hawkish turn. Additionally, at the September meeting 4 officials thought 2 more rate hikes would be needed this year. The median forecaster did not see rate reductions until 2028.
The hawkish turn under Chair Warsh’s first few months at the helm stands in stark contrast to the concerns that surrounded his appointment. There were widespread concerns that he would come into office with a bias toward cutting rates. But as we argued in May, the economic conditions would end up driving the path for monetary policy. The Iran War, surging energy prices, and fears of spillovers into other consumer prices won the day. As we discuss below, those concerns are likely behind us.
Figure 1: Most Fed Officials Expected Another Hike in 2026
A Dramatic Change for Inflation Data After the Rate Hike
The Fed’s preferred inflation gauge looks very different now than at the time of the rate hike due to revisions. Tracking all consumer prices on a monthly basis in a $32 trillion economy is a challenging endeavor for the government agencies. It is sometimes more art than science. And just as restoration and retouching of a painting can alter its appearance, data revisions have changed the look of inflation.
The Fed was spooked by core PCE inflation that was high and had been accelerating through 2026, but some of the components needed a touch up. The revisions were released two weeks after the Fed decision and affected PCE data for the most recent 5 years. Most significantly, the statisticians changed the way they measure the prices for portfolio management. The prevailing method essentially recorded higher prices when the equity market boomed (even though prices hadn’t actually changed) and overstated inflation. There were also changes to measurement of legal fees, computer software, and computer related equipment.
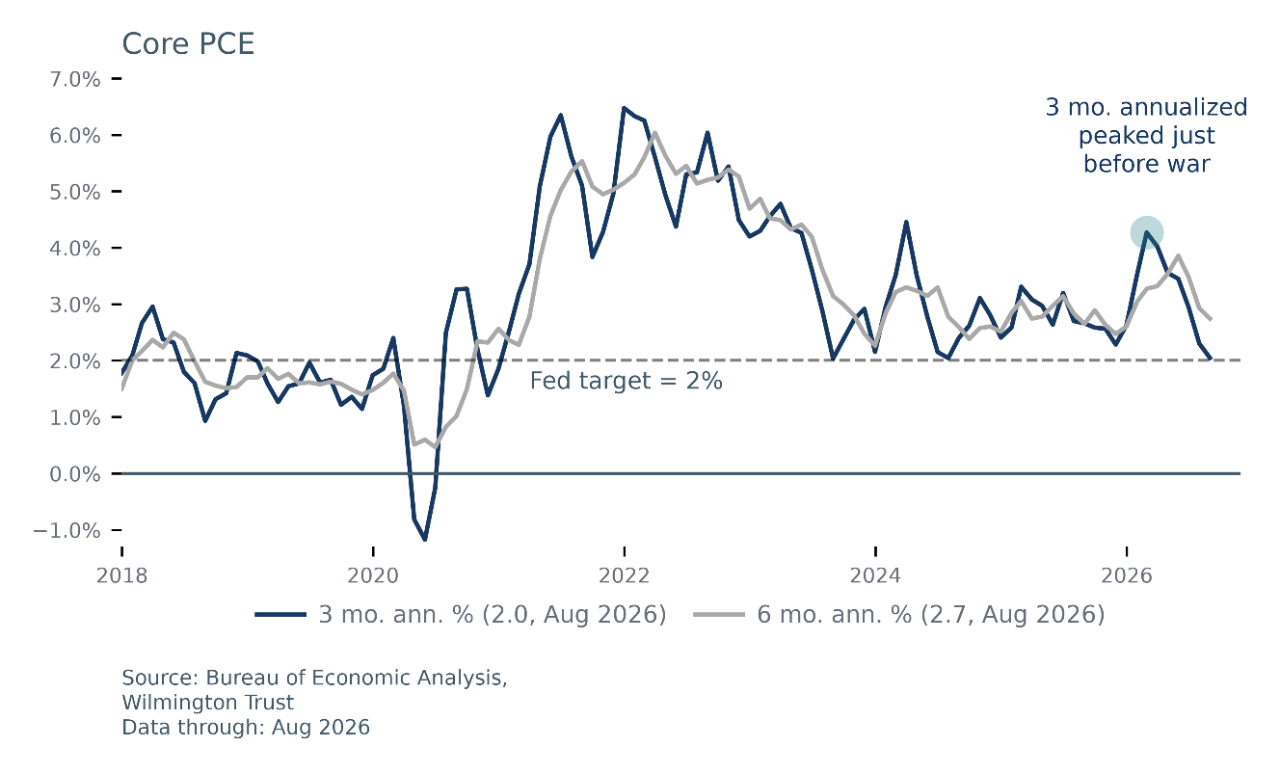
The revised data was released along with the August 2026 measurements and now inflation looks very different. On a 3-month annualized basis, core PCE is at the Fed’s target of 2% (Figure 2). In fact, it has slowed consistently since the start of the Iran War, an encouraging sign that the feared spillovers have not transpired. On a 6-month annualized basis core PCE has advanced 2.7%. That is still above the Fed’s target but is headed in the right direction and far less concerning than before the revisions.
The data revisions reinforce our view that there is very little inflation pressure coming from consumer strength. The main component that remains high is medical care costs, which are important but are chiefly paid for by insurance and are not a signal of robust consumer spending. Another item with strong price pressure is computer equipment, but that is coming from Artificial Intelligence (AI) investment driving up prices, while consumer sales volumes have been weak. Consumers are facing slow job growth, slowing wage growth, and high prices at the pump, and are forced to be more discerning with their spending. That is helping overall inflation remain muted.
We expect inflation to continue slowing down, enabling the Fed to take a less hawkish stance. As mentioned above, nearly all Fed officials communicated an expectation of at least one more hike in 2026. But with the new inflation data in hand, their inflation forecasts now look too high and will likely be revised down. Indeed, Fed Vice Chair Jefferson and New York Fed President Williams have already issued dovish statements within the past week. Williams said there “is no need for urgency,” pushing back on the market pricing for a hike in October. Jefferson sounded as though he was pushing back on a hike next month. Over the past 10 days the market pricing for an October rate hike fell from 70% to 20%. Governor Waller, often seen as a bellwether for changes in the FOMC’s policy bias, said on October 8 the group has “flexibility” on the timing of future rate hikes, likely signaling a pause at the upcoming October 28 meeting.
Figure 2: Core Inflation Continues to Slow Down and Ease Pressure on the Fed
Long-Term Rates Continue Marching Higher
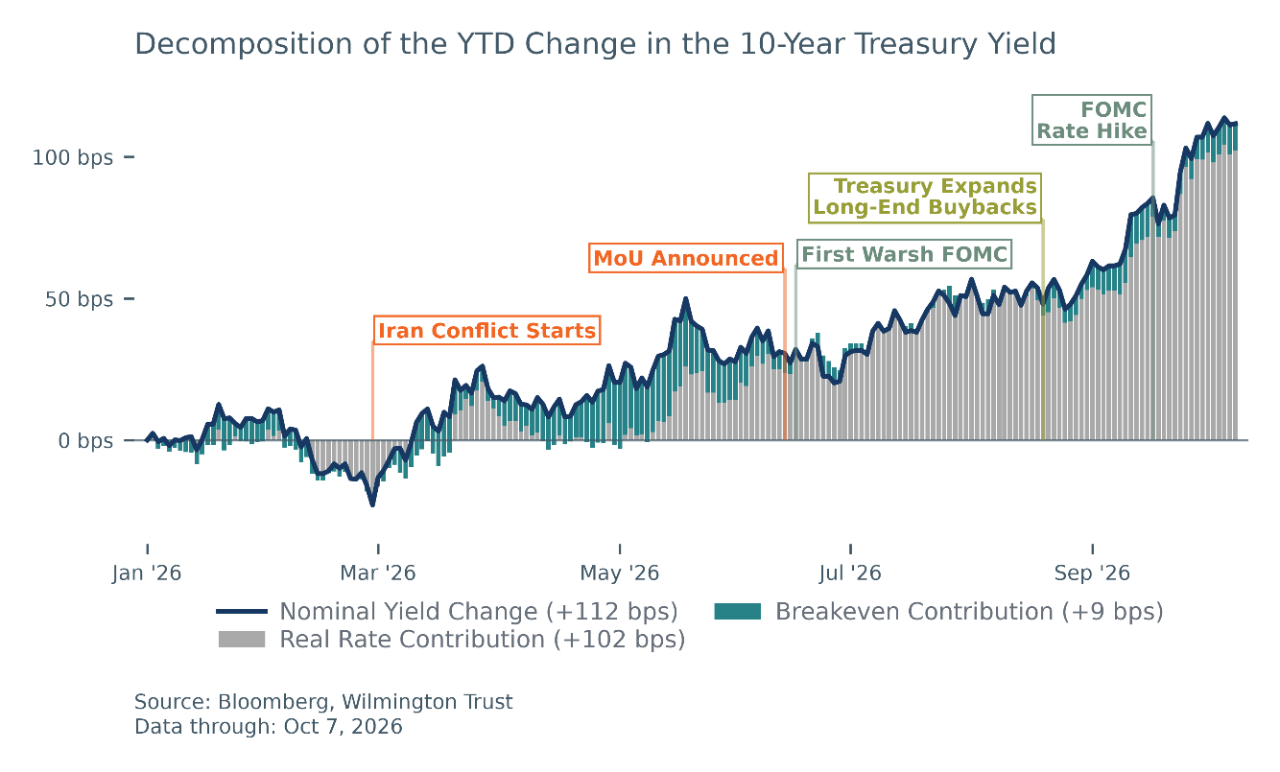
The climb in long-term interest rates that began early this year continued through September, and while breakeven inflation did contribute modestly, the increase was predominantly driven by real rates (Figure 3). Seemingly little has been able to stem the rise, as increased buybacks and language from the Treasury suggesting greater support for long bonds have generated only momentary relief. Our view of the key drivers of the rise in real rates is little changed from our piece from August where we described long-term rates as being pressured by a glut of global debt. That is coming from elevated government deficits in many of the world’s largest economies, the related issue of unsustainable debt trajectories, and a boom in corporate debt supply driven by the AI capex buildout.
Figure 3: The U.S. 10-Year Yield Has Surged Since the Start of the War
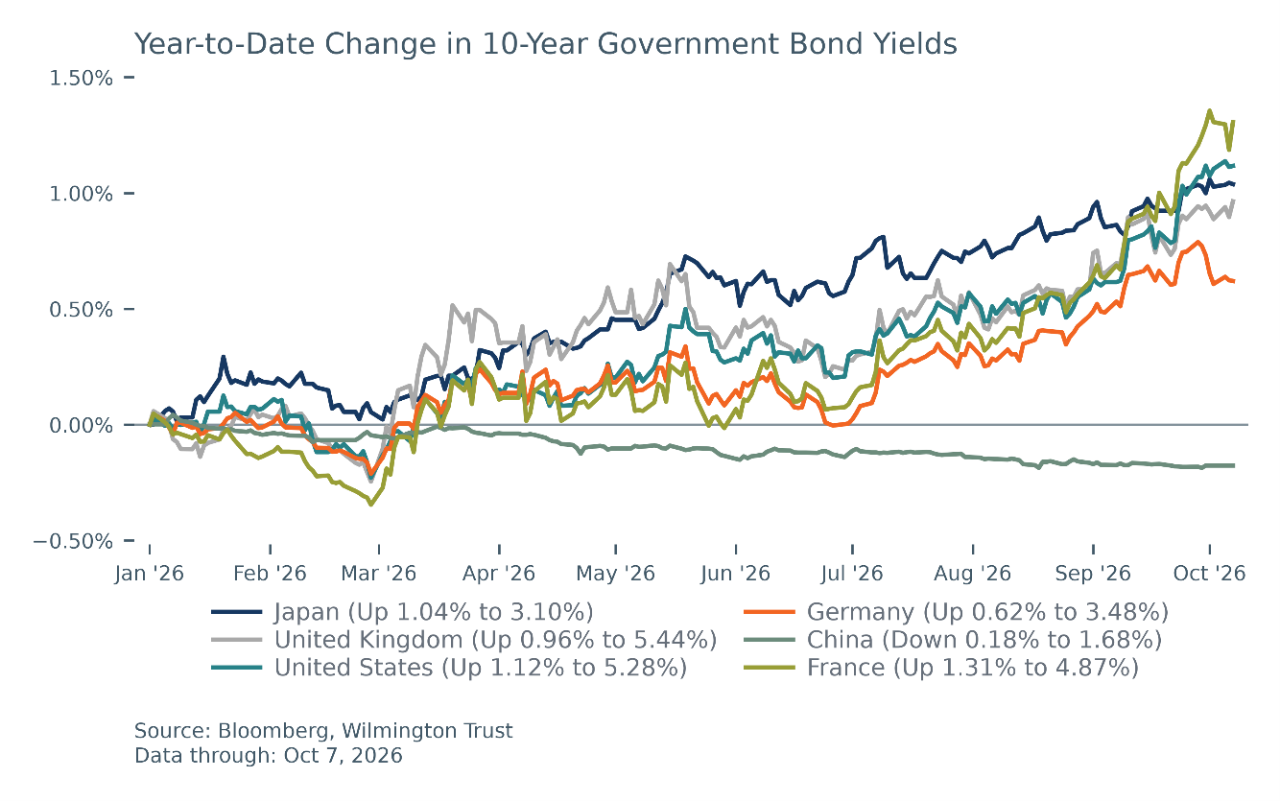
While we view all of these factors as contributing to the most recent leg up in long-term interest rates, we have seen a particularly pronounced jump coinciding with a worsening of the outlook for France’s debt trajectory (Figure 4). In addition to having one of the highest debt-to-GDP levels among developed economies, markets perceive France as lacking the political will to address its fiscal situation across the political spectrum as elections approach. For much of the year, Japan had seen the highest cumulative rise in its long-term interest rates, but fiscal concerns saw France overtake Japan last month. Interest rates in the world’s developed economies tend to move together, both because of fundamental economic interconnectedness and because developed market bonds serve as substitutes for investors to an extent.
All of these factors have played a role in the rise in long-term rates, as we have seen concerns broadly worsen over global debt trajectories and the political will to address them, expectations for enormous AI capital expenditures to persist, and an uptick in inflation breakeven rates due to restoking of the conflict in Iran and the opening of a new front in Yemen. As of now, long-term inflation breakeven rates remain mostly contained despite the modest uptick that we have seen. However, there has been damage to refining capacity in the Middle East that is beginning to drive a wedge between prices for crude oil and refined products. We do not view these risks as sufficient to derail the expansion in the U.S. economy, though we are monitoring them closely, and we also view real yields as having reached attractive levels.
Figure 4: The U.S. is Not Alone
Core Narrative
When we added risk to portfolios at midyear, a key pillar of that decision was our view that the economy was strong enough to avoid recession but not strong enough to generate sustained inflation. Recent developments reinforce that outlook. Inflation data has softened materially following revisions and weaker recent readings, labor market data has moderated, and Fed officials have begun signaling less urgency around additional rate hikes. At the same time, long-term interest rates have continued to rise, driven more by higher real yields and global debt concerns than by a deterioration in the inflation outlook.
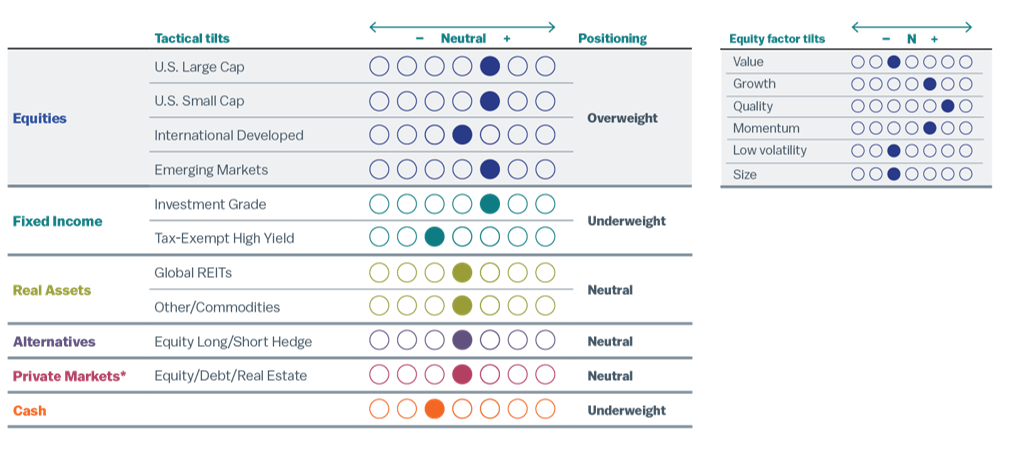
We continue to favor risk assets and maintain our overweight to equities, supported by resilient economic growth and earnings. However, the sharp rise in long-term rates has improved the opportunity set in fixed income. As a result, we recently increased exposure to investment-grade bonds and reduced our aggregate underweight to fixed income while maintaining our broader pro-risk positioning. Our base case remains that slowing inflation will allow the Federal Reserve to reduce rates in 2027, which would be supportive of both high-quality bonds and longer-duration equity assets.
Figure 5: Overweight to Risk in Portfolios
High-Net-Worth Portfolios with Private Markets
Data as of September 30, 2026. Positioning reflects our monthly tactical asset allocation (TAA) versus the long-term strategic asset allocation (SAA) benchmark. For an overview of our asset allocation strategies, please see the disclosures.
*Private markets are only available to investors that meet Securities and Exchange Commission standards and are qualified and accredited. We recommend a strategic allocation to private markets we do not tactically adjust this asset class.
Disclosures
Facts and views presented in this report have not been reviewed by, and may not reflect information known to, professionals in other business areas of Wilmington Trust or M&T Bank who may provide or seek to provide financial services to entities referred to in this report. M&T Bank and Wilmington Trust have established information barriers between their various business groups. As a result, M&T Bank and Wilmington Trust do not disclose certain client relationships with, or compensation received from, such entities in their reports.
The information on Wilmington Wire has been obtained from sources believed to be reliable, but its accuracy and completeness are not guaranteed. The opinions, estimates, and projections constitute the judgment of Wilmington Trust and are subject to change without notice. This commentary is for informational purposes only and is not intended as an offer or solicitation for the sale of any financial product or service or a recommendation or determination that any investment strategy is suitable for a specific investor. Investors should seek financial advice regarding the suitability of any investment strategy based on the investor’s objectives, financial situation, and particular needs. Diversification does not ensure a profit or guarantee against a loss. There is no assurance that any investment strategy will succeed.
Past performance cannot guarantee future results. Investing involves risk and you may incur a profit or a loss.
Indexes are not available for direct investment. Investment in a security or strategy designed to replicate the performance of an index will incur expenses such as management fees and transaction costs which will reduce returns.
References to specific securities are not intended and should not be relied upon as the basis for anyone to buy, sell, or hold any security. Holdings and sector allocations may not be representative of the portfolio manager’s current or future investment and are subject to change at any time.
Reference to the company names and/or securities mentioned in this blog is merely for explaining the market view and should not be construed as investment advice or investment recommendations of those companies and/or securities. Third party trademarks and brands are the property of their respective owners.
Any investment products discussed in this commentary are not insured by the FDIC or any other governmental agency, are not deposits of or other obligations of or guaranteed by M&T Bank, Wilmington Trust, or any other bank or entity, and are subject to risks, including a possible loss of the principal amount invested.
Some investment products may be available only to certain “qualified investors”—that is, investors who meet certain income and/or investable assets thresholds.
Alternative assets, such as strategies that invest in hedge funds, can present greater risk and are not suitable for all investors.
An Overview of Our Asset Allocation Strategies
Wilmington Trust offers seven asset allocation models for taxable (high-net-worth) and tax-exempt (institutional) investors across five strategies reflecting a range of investment objectives and risk tolerances: Aggressive, Growth, Growth & Income, Income & Growth, and Conservative. The seven models are High Net Worth (HNW), HNW with Liquid Alternatives, HNW with Private Markets, HNW Tax Advantaged, Institutional, Institutional with Hedge LP, and Institutional with Private Markets. As the names imply, the strategies vary with the type and degree of exposure to hedge strategies and private market exposure, as well as with the focus on taxable or tax-exempt income. On a quarterly basis we publish the results of all of these strategy models versus benchmarks representing strategic implementation without tactical tilts.
Model Strategies may include exposure to the following asset classes: U.S. large-capitalization stocks, U.S. small-cap stocks, developed international stocks, emerging market stocks, U.S. and international real asset securities (including inflation-linked bonds and commodity-related and real estate-related securities), U.S. and international investment-grade bonds (corporate for Institutional or Tax Advantaged, municipal for other HNW), U.S. and international speculative grade (high-yield) corporate bonds and floating-rate notes, emerging markets debt, and cash equivalents. Model Strategies employing nontraditional hedge and private market investments will, naturally, carry those exposures as well. Each asset class carries a distinct set of risks, which should be reviewed and understood prior to investing.
ALLOCATIONS:
Each strategy group is constructed with target policy weights for each asset class. Wilmington Trust periodically adjusts the policy weights target allocations and may shift away from the target allocations within certain ranges. Such tactical adjustments to allocations typically are considered on a monthly basis in response to market conditions. The asset classes and their current proxies are:
• Large–cap U.S. stocks: Russell 1000® Index
• Small–cap U.S. stocks: Russell 2000® Index
• Developed international stocks: MSCI EAFE® (Net) Index
• Emerging market stocks: MSCI Emerging Markets Index
• U.S. inflation-linked bonds: Bloomberg US Treasury Inflation Notes TR Index Value Unhedged USD (took effect 8/1/22)
• International inflation-linked bonds: Bloomberg World ex US ILB (Hedged) Index
• Commodity-related securities: Bloomberg Commodity Index
• U.S. REITs: S&P US REIT Index
• International REITs: Dow Jones Global ex US Select RESI Index
• Private markets: S&P Listed Private Equity Index
• Hedge funds: HFRX Global Hedge Fund Index (took effect 8/1/22)
• U.S. taxable, investment-grade bonds: Bloomberg U.S. Aggregate Index
• U.S. high-yield corporate bonds: Bloomberg U.S. Corporate High Yield Index
• U.S. municipal, investment-grade bonds: S&P Municipal Bond Index
Risk Assumptions
All investments carry some degree of risk. The volatility, or uncertainty, of future returns is a key concept of investment risk. Standard deviation is a measure of volatility and represents the variability of individual returns around the mean, or average annual, return. A higher standard deviation indicates more return volatility. This measure serves as a collective, quantitative estimate of risks present in an asset class or investment (e.g., liquidity, credit, and default risks). Certain types of risk may be underrepresented by this measure. Investors should develop a thorough understanding of the risks of any investment prior to committing funds.
Stay Informed
Subscribe
Ideas, analysis, and perspectives to help you make your next move with confidence.
What can we help you with today