Equal Housing Lender. © 2026 M&T Bank and its affiliates and subsidiaries. NMLS #381076. M&T Bank Member FDIC.
Institutional Services Insights
Wealth Management Insights
Who We Are
Log In
Select Business Area
Our Services
Institutional Services Insights
Long-term Treasury yields have moved sharply higher in recent weeks, raising concerns about the consequences for borrowing costs, bond returns, and equity valuations. On Tuesday August 18, the 30-year Treasury yield reached 5.34%, its highest level since 2007, while the 10-year yield traded above 4.7%[1]. On Wednesday, the U.S. Treasury provided some relief to the Treasury market by announcing larger buybacks of long-term securities[2] and pushing yields lower, but this was followed by a rebound in yields the next day that has since persisted. Simply put, long-term interest rates are stuck at higher levels than investors have become accustomed to.
The recent move reflects several overlapping forces. The renewed U.S.-Iran conflict has raised concerns about energy prices and inflation. Large federal deficits and growing artificial intelligence infrastructure investment are increasing the amount of debt competing for investor capital. The move is not isolated to the U.S., as long-term sovereign yields have also risen across most major economies due to shared structural factors. Finally, uncertainty about the direction and communication of Federal Reserve policy may have raised the additional compensation that investors require to hold long-term bonds relative to shorter-term instruments.
The Decomposition of Treasury Yields
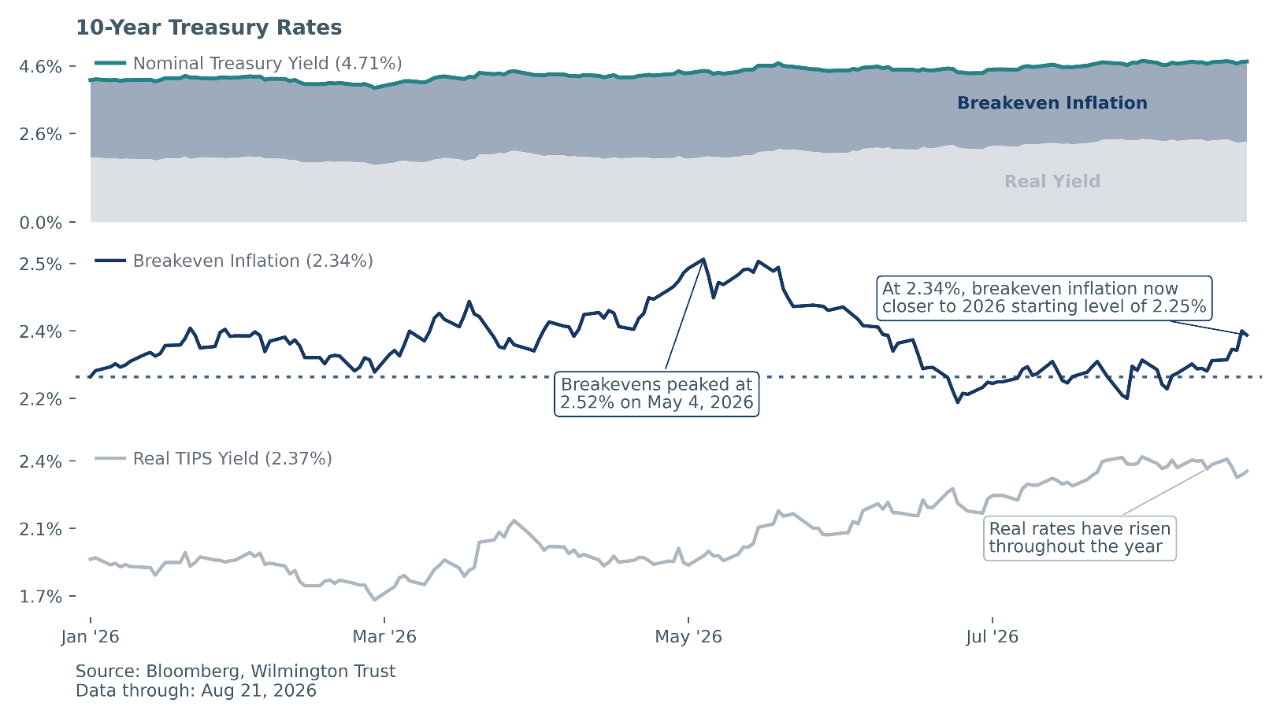
The yield on a traditional U.S. Treasury security can be divided into two broad components: the real yield, which represents the return investors receive after accounting for inflation, and the compensation that investors receive for expected inflation, which is measured by the breakeven inflation rate.
The real-yield component can be observed via the rate on Treasury Inflation-Protected Securities (TIPS), which helps work to protect investors against the loss of purchasing power due to inflation. This works through adjustments to the principal value of a TIPS security, which rises or falls when the Consumer Price Index does, and its interest payments rise or fall with that inflation-adjusted principal. This means that the rate investors receive nets out the impact of inflation or, in other words, represents the real yield.
The difference between the yields on nominal Treasury and TIPS securities of the same maturity is known as the breakeven inflation rate. This is the average inflation rate over the life of the securities at which an investor would earn approximately the same return from either investment. Breakevens are commonly used as a measure of market inflation expectations, although they also reflect inflation risk premiums and differences in liquidity between TIPS and nominal Treasurys.
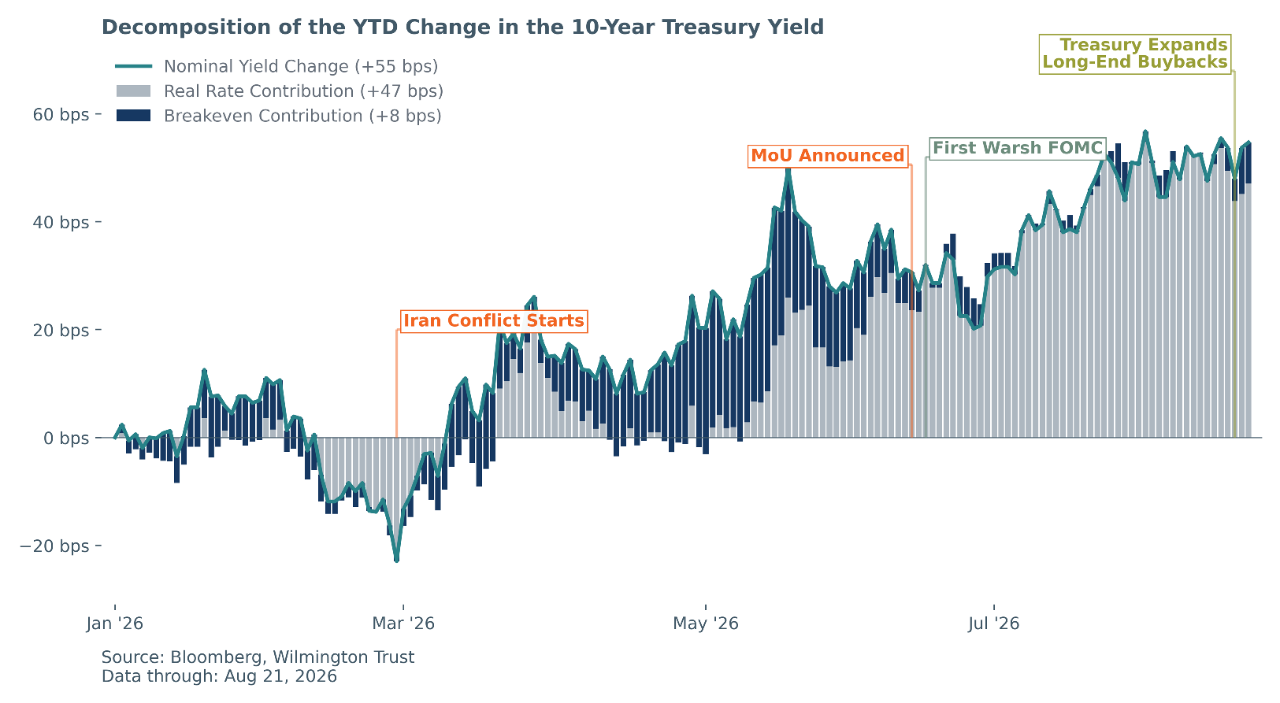
This distinction helps explain the recent increase in long-term rates. The initial rise in the 10-year Treasury yield following the start of the U.S.-Iran conflict included a meaningful increase in breakeven inflation as disrupted Gulf oil shipments pushed energy prices higher, peaking on May 4 at the conflict’s greatest intensity. From there, breakevens gradually declined as the conflict inched closer to its first détente under the June Memorandum of Understanding (MoU). Recently, they have risen modestly with reacceleration in the conflict but remain well below their summer highs. The net increase in the 10-year Treasury yield since the end of February has therefore come overwhelmingly from real yields rather than inflation expectations.
Figure 1: Contribution to Treasury Rates (Top), Breakeven Inflation (Middle), TIPS (Bottom)
Several forces appear to be contributing to the rise in real yields:
More Borrowers Are Competing for Capital
The buildout of artificial intelligence infrastructure is creating substantial demand for funding. Data centers require large expenditures on computing equipment, construction, and supporting infrastructure. They also consume considerable amounts of electricity, creating an accompanying need for investment in power generation and transmission.
Some of this investment has been financed through retained earnings and equity issuance, but technology companies and infrastructure providers are increasingly turning to public and private debt markets. These securities compete with Treasurys and other fixed-income instruments for investor capital. High-quality corporate bonds offering attractive yields may draw some capital away from Treasurys, requiring higher Treasury yields to attract sufficient demand. The Federal Reserve Bank of Dallas has identified long-term corporate issuance, private-credit hedging, and the displacement of other borrowers as channels through which AI financing may increase the supply of duration in fixed-income markets and affect term premiums[3].
Large and persistent federal deficits are one of the key drivers of this competition. Elevated U.S. deficits require the Treasury to issue more securities for investors to absorb. Fiscal uncertainty surrounding the midterm elections may contribute to shorter-term volatility, but the broader pressure from government borrowing has developed across administrations and is unlikely to disappear after any particular election cycle.
Simply put, fixed-income investors are facing a glut of potential investment options that has expanded at a rapid pace. When demand for capital from bond issuers is outstripping the available supply from investors, interest rates for those investments face upward pressure.
Federal Reserve Policy and the Term Premium
Expectations that the Federal Reserve will reduce the size of its balance sheet relative to the economy over time may also be contributing to higher real yields. “Quantitative easing”, or “QE”, refers to large-scale Federal Reserve purchases of longer-term securities, while “quantitative tightening”, or “QT”, conversely reflects the reduction in purchases or outright sale of those securities. Being a large buyer, the additional demand from the Fed generally supports Treasury prices and places downward pressure on yields. QE by the Fed was one factor contributing to exceptionally low real yields following the global financial crisis.
Chair Kevin Warsh has been a critic of the scale and duration of post-crisis asset purchases. Markets have generally expected that he will favor a smaller Federal Reserve balance sheet relative to the size of the U.S. economy. A smaller Fed footprint in the Treasury market would leave private investors to absorb a greater share of outstanding securities, placing upward pressure on long-term real yields for the same supply and demand reasons outlined above.
There has also been speculation of a separate Warsh-related effect operating through the term premium. The term premium is the additional yield investors demand to hold a long-term bond rather than repeatedly investing in shorter-term securities. It tends to rise when investors perceive greater uncertainty about inflation, monetary policy, or future Treasury supply.
Warsh has expressed a desire to have markets focus less on the Fed and more on economic developments. To this end, he has advocated for a reduction in the frequency and length of Fed communication through shorter meeting statements, less “forward guidance”, and potentially via fewer meetings each year. If this approach proves effective, it could contribute to more efficient market functioning. That said, less communication also may introduce uncertainty as to how the Fed may adjust its policy in response to future economic developments – its so-called “reaction function”.
This greater uncertainty over the path of Fed policy can raise the yield on long-term Treasurys. However, this effect does not necessarily have to persist. Over time, if communications from the Fed gradually provide information about its reaction function and investors gain greater clarity about the Fed’s balance sheet and interest-rate policies, some of the uncertainty premium embedded in long-term yields could recede.
We also do not view this as a major driver of the rise in real rates relative to the other factors we have discussed. The Federal Reserve Bank of San Francisco estimated the 10-year Treasury term premium at 1.36% compared with 1.24% a year ago[4], with some portion of this rise potentially reflecting uncertainty about the future direction of Fed policy. Term-premium estimates are model-dependent, but the increase is consistent with investors demanding greater compensation for the risks associated with holding longer-maturity Treasurys.
Higher Yields Are a Global Development
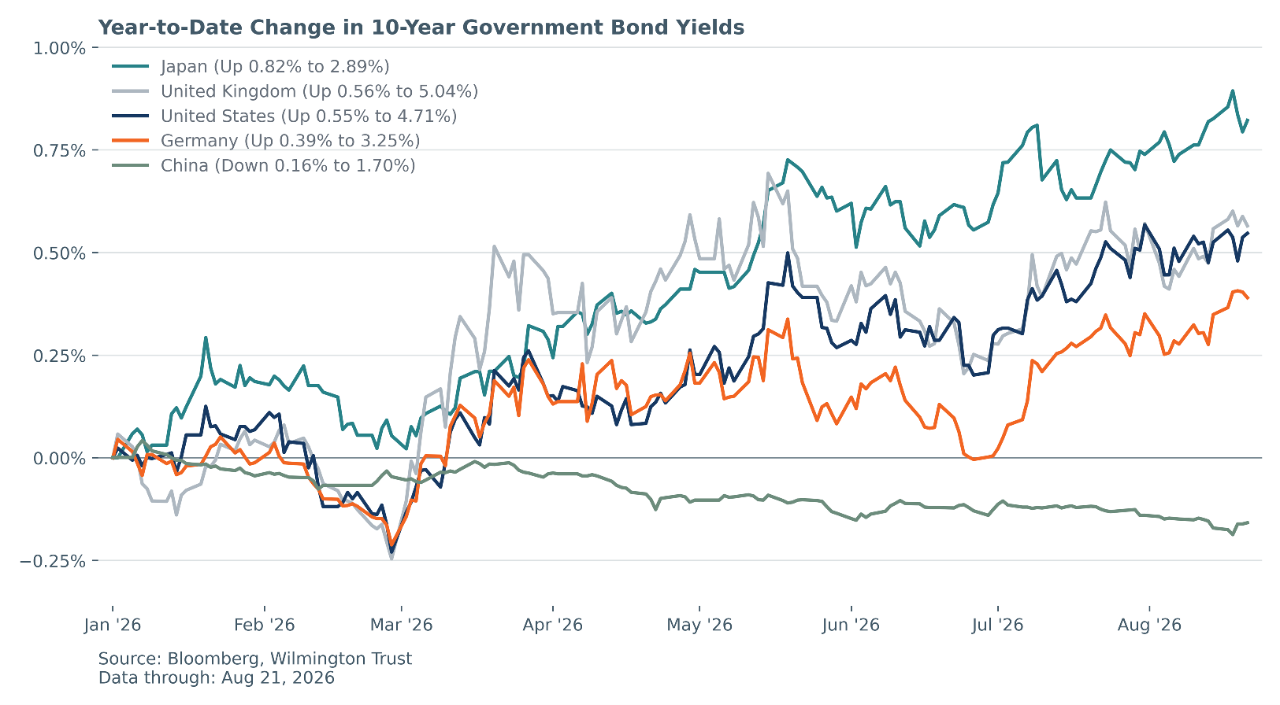
The rise in long-term yields is not limited to the United States. Sovereign yields have also moved higher in the world’s largest developed economies, including Japan, Germany, and the United Kingdom. This points to shared underlying pressures rather than concerns related specifically to U.S. monetary policy.
Most of the world’s largest economies carry high government debt relative to GDP and continue to issue substantial amounts of sovereign debt. Differences in inflation, central-bank policy, economic growth, and currencies also matter, but elevated government borrowing is likely one of the structural forces placing upward pressure on long-term interest rates globally. That supply competes for a global pool of investor capital, which only exacerbates the glut of capital demand coming from the U.S. Treasury and AI capex buildout.
China is the notable exception. While long-term government bond yields have risen across most major economies, China’s 10-year government bond yield has declined. The key distinction is that China has faced persistent deflationary pressure, reflecting in part the prolonged property downturn and persistently soft domestic demand. Falling property values have weighed on household wealth and confidence, while subdued spending has limited pricing power across the economy. These conditions have reduced inflation expectations and supported expectations for accommodative monetary policy, placing downward pressure on long-term Chinese interest rates.
Figure 2: Government bond yields
Underlying Drivers Are Difficult to Solve
The U.S. Treasury is providing some offset to these pressures through its issuance and buyback policies. Since 2023, the Treasury has leaned more heavily towards short-term bill issuance, on the margin reducing the relative supply of long-term debt that markets must absorb. This both decreases the amount of upward pressure on long-term interest rates and results in lower borrowing costs for the Treasury in the short term, since long-term rates tend to be higher. This strategy has worked as intended thus far but has limits, as it exposes the Treasury to unexpected rises in short-term rates that could introduce risk if the macroeconomic environment changes.
This week also saw the Treasury expand its use of buybacks to support the long end of the market and counter the recent rise in yields. On Wednesday August 19, Treasury announced that it would at least double the maximum size of liquidity-support buybacks for nominal securities in the 10-to-20-year and 20-to-30-year sectors. The maximum size will rise from $2 billion to at least $4 billion per operation beginning September 9 and remain in effect through November 4. Treasury said the operations are intended to support liquidity in longer-dated nominal securities.
These buybacks are somewhat analogous to QE because they remove selected long-term Treasury securities from the market, supporting their prices and placing downward pressure on their yields. The key difference is how the purchases are financed. The Treasury issues other debt to fund the buybacks, primarily shifting some of the financing burden from longer to shorter maturities. QE, by contrast, involves purchases by the Fed and an expansion of the central bank’s balance sheet. There is a direct historical analogue from the Fed in Operation Twist, undertaken in both 1961 and 2011, in which the central bank purchased long-term securities and sold short-term securities in order to dampen long-term interest rates in a fashion that reduced its overall market impact.
The initial market response was both immediate and pronounced. The 10-year Treasury yield declined by approximately 0.06%, while the 30-year yield fell by approximately 0.10% soon after the Treasury’s announcement. The reaction suggests that the market ascribed weight to both the Treasury’s willingness to support to the long end of the yield curve and the signal that it is sensitive to disorderly rises in rates. However, the market’s reaction on the following day was just as telling. On Thursday, yields bounced up to roughly their levels from before the buyback announcement and have since persisted. The reversal underscores that the buyback announcement helped to cap the move in rates on Wednesday but does not materially alter the broader forces placing upward pressure on long-term rates. The rise in interest rates this year has continued irrespective of factors that the market views as more temporary in nature.
Figure 3: Drivers of rise in 10-year Treasury yield
Core Narrative
Many of the forces supporting higher real yields have structural economic foundations. That also does not mean that Treasury yields must continue rising further from today’s levels. The relevant questions are how much of the risk has already been incorporated into bond prices and how these factors develop from here.
In our view, the forces driving core disinflation in the United States remain intact, while current oil prices are manageable and only moderately elevated relative to history. Breakevens indicate that long-term inflation expectations remain under control, and if our view plays out, we believe that we could see further deceleration in breakeven inflation and downward pressure on rates as a result. A renewed ceasefire or more durable resolution that reopens Gulf oil shipments would likely reduce energy prices and inflation expectations. Contained inflation expectations would also give the Federal Reserve greater latitude to reduce short-term interest rates if macroeconomic data continue to play out as we expect.
We view global debt sustainability as an important and persistent long-term risk, but not as an immediate threat. Current Treasury yields already incorporate a meaningful degree of concern about expanding sovereign debt and the increasing supply of fixed-income securities. We also do not expect a dramatic near-term change in the Fed’s balance sheet policy. As markets learn more about the Fed’s reaction function under Chair Warsh, some of the term premium associated with that uncertainty could decline.
The rise in Treasury yields has also not been met with any significant deterioration in corporate credit markets. Credit spreads have widened modestly but remain well behaved and low relative to history, suggesting that investors remain broadly comfortable with the prospects for corporate borrowers. This is consistent with the strong performance of equities despite higher interest rates. At the same time, the tight levels of investment-grade and high-yield spreads leave relatively little room for error if economic growth deteriorates.
For bond investors, higher starting yields provide more income and a larger cushion against additional rate volatility. The structural forces supporting higher real rates are unlikely to disappear, but current yields may increasingly compensate investors for those risks. If disinflation continues and the conflict with Iran eventually deescalates, investors entering at current levels could also benefit from a decline in longer-term yields.
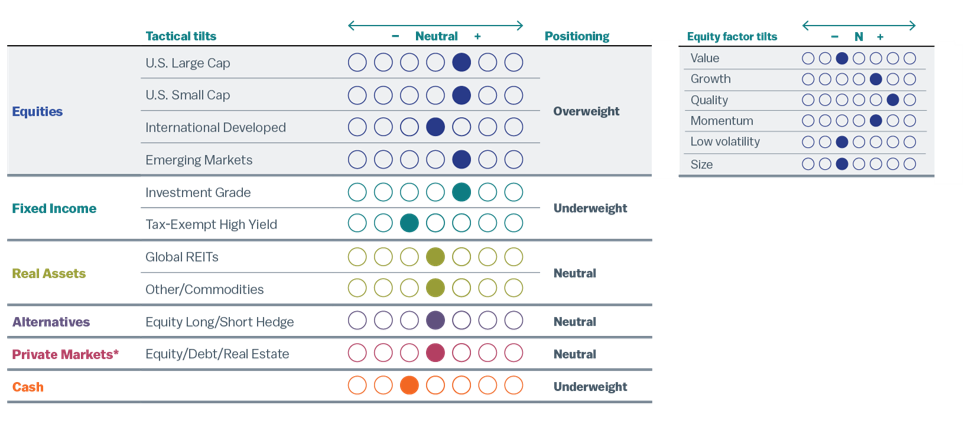
All things considered, we view the potential for rates to rise further as an important risk, but not one that is sufficient to derail an otherwise constructive environment for risk assets. We maintain an overweight to equity markets and underweight to fixed income overall, as we view the current environment as favorable to equities over fixed income, in part for the reasons discussed, though we also do not anticipate a substantial acceleration in long-term interest rates from here.
Figure 4: Current Positioning
Data as of June 30, 2026. Positioning reflects our monthly tactical asset allocation (TAA) versus the long-term strategic asset allocation (SAA) benchmark. For an overview of our asset allocation strategies, please see the disclosures.
*Private markets are only available to investors that meet Securities and Exchange Commission standards and are qualified and accredited. We recommend a strategic allocation to private markets we do not tactically adjust this asset class.
[1] US 30-year yields hit highest level since 2007 as war, oil worries fester | Reuters
[2] Treasury Secretary Bessent doubles US long-bond buybacks in the face of surging yields | Reuters
[3] How AI debt financing impacts duration supply and interest rates - Dallasfed.org
[4] Treasury Yield Premiums - San Francisco Fed
Definitions
Consumer Price Index is a measure of the average change over time in the prices consumers pay for a basket of goods and services, such as housing, food, transportation, healthcare, and entertainment. It is one of the most widely used measures of inflation.
Sovereign yields are the interest rates that governments pay to borrow money by issuing bonds. Examples include U.S. Treasury yields, German Bund yields, UK Gilt yields, and Japanese Government Bond (JGB) yields.
Disclosures
Facts and views presented in this report have not been reviewed by, and may not reflect information known to, professionals in other business areas of Wilmington Trust or M&T Bank who may provide or seek to provide financial services to entities referred to in this report. M&T Bank and Wilmington Trust have established information barriers between their various business groups. As a result, M&T Bank and Wilmington Trust do not disclose certain client relationships with, or compensation received from, such entities in their reports.
The information on Wilmington Wire has been obtained from sources believed to be reliable, but its accuracy and completeness are not guaranteed. The opinions, estimates, and projections constitute the judgment of Wilmington Trust and are subject to change without notice. This commentary is for informational purposes only and is not intended as an offer or solicitation for the sale of any financial product or service or a recommendation or determination that any investment strategy is suitable for a specific investor. Investors should seek financial advice regarding the suitability of any investment strategy based on the investor’s objectives, financial situation, and particular needs. Diversification does not ensure a profit or guarantee against a loss. There is no assurance that any investment strategy will succeed.
Past performance cannot guarantee future results. Investing involves risk and you may incur a profit or a loss.
Indexes are not available for direct investment. Investment in a security or strategy designed to replicate the performance of an index will incur expenses such as management fees and transaction costs which will reduce returns.
References to specific securities are not intended and should not be relied upon as the basis for anyone to buy, sell, or hold any security. Holdings and sector allocations may not be representative of the portfolio manager’s current or future investment and are subject to change at any time.
Reference to the company names and/or securities mentioned in this blog is merely for explaining the market view and should not be construed as investment advice or investment recommendations of those companies and/or securities. Third party trademarks and brands are the property of their respective owners.
Any investment products discussed in this commentary are not insured by the FDIC or any other governmental agency, are not deposits of or other obligations of or guaranteed by M&T Bank, Wilmington Trust, or any other bank or entity, and are subject to risks, including a possible loss of the principal amount invested.
Some investment products may be available only to certain “qualified investors”—that is, investors who meet certain income and/or investable assets thresholds.
Alternative assets, such as strategies that invest in hedge funds, can present greater risk and are not suitable for all investors.
An Overview of Our Asset Allocation Strategies
Wilmington Trust offers seven asset allocation models for taxable (high-net-worth) and tax-exempt (institutional) investors across five strategies reflecting a range of investment objectives and risk tolerances: Aggressive, Growth, Growth & Income, Income & Growth, and Conservative. The seven models are High Net Worth (HNW), HNW with Liquid Alternatives, HNW with Private Markets, HNW Tax Advantaged, Institutional, Institutional with Hedge LP, and Institutional with Private Markets. As the names imply, the strategies vary with the type and degree of exposure to hedge strategies and private market exposure, as well as with the focus on taxable or tax-exempt income. On a quarterly basis we publish the results of all of these strategy models versus benchmarks representing strategic implementation without tactical tilts.
Model Strategies may include exposure to the following asset classes: U.S. large-capitalization stocks, U.S. small-cap stocks, developed international stocks, emerging market stocks, U.S. and international real asset securities (including inflation-linked bonds and commodity-related and real estate-related securities), U.S. and international investment-grade bonds (corporate for Institutional or Tax Advantaged, municipal for other HNW), U.S. and international speculative grade (high-yield) corporate bonds and floating-rate notes, emerging markets debt, and cash equivalents. Model Strategies employing nontraditional hedge and private market investments will, naturally, carry those exposures as well. Each asset class carries a distinct set of risks, which should be reviewed and understood prior to investing.
ALLOCATIONS:
Each strategy group is constructed with target policy weights for each asset class. Wilmington Trust periodically adjusts the policy weights target allocations and may shift away from the target allocations within certain ranges. Such tactical adjustments to allocations typically are considered on a monthly basis in response to market conditions. The asset classes and their current proxies are:
• Large–cap U.S. stocks: Russell 1000® Index
• Small–cap U.S. stocks: Russell 2000® Index
• Developed international stocks: MSCI EAFE® (Net) Index
• Emerging market stocks: MSCI Emerging Markets Index
• U.S. inflation-linked bonds: Bloomberg US Treasury Inflation Notes TR Index Value Unhedged USD (took effect 8/1/22)
• International inflation-linked bonds: Bloomberg World ex US ILB (Hedged) Index
• Commodity-related securities: Bloomberg Commodity Index
• U.S. REITs: S&P US REIT Index
• International REITs: Dow Jones Global ex US Select RESI Index
• Private markets: S&P Listed Private Equity Index
• Hedge funds: HFRX Global Hedge Fund Index (took effect 8/1/22)
• U.S. taxable, investment-grade bonds: Bloomberg U.S. Aggregate Index
• U.S. high-yield corporate bonds: Bloomberg U.S. Corporate High Yield Index
• U.S. municipal, investment-grade bonds: S&P Municipal Bond Index
Risk Assumptions
All investments carry some degree of risk. The volatility, or uncertainty, of future returns is a key concept of investment risk. Standard deviation is a measure of volatility and represents the variability of individual returns around the mean, or average annual, return. A higher standard deviation indicates more return volatility. This measure serves as a collective, quantitative estimate of risks present in an asset class or investment (e.g., liquidity, credit, and default risks). Certain types of risk may be underrepresented by this measure. Investors should develop a thorough understanding of the risks of any investment prior to committing funds.
Stay Informed
Subscribe
Ideas, analysis, and perspectives to help you make your next move with confidence.
What can we help you with today