 Equal Housing Lender. © 2026 M&T Bank. NMLS #381076. Member FDIC. All rights reserved.
 Equal Housing Lender. © 2026 M&T Bank. NMLS #381076. Member FDIC. All rights reserved.
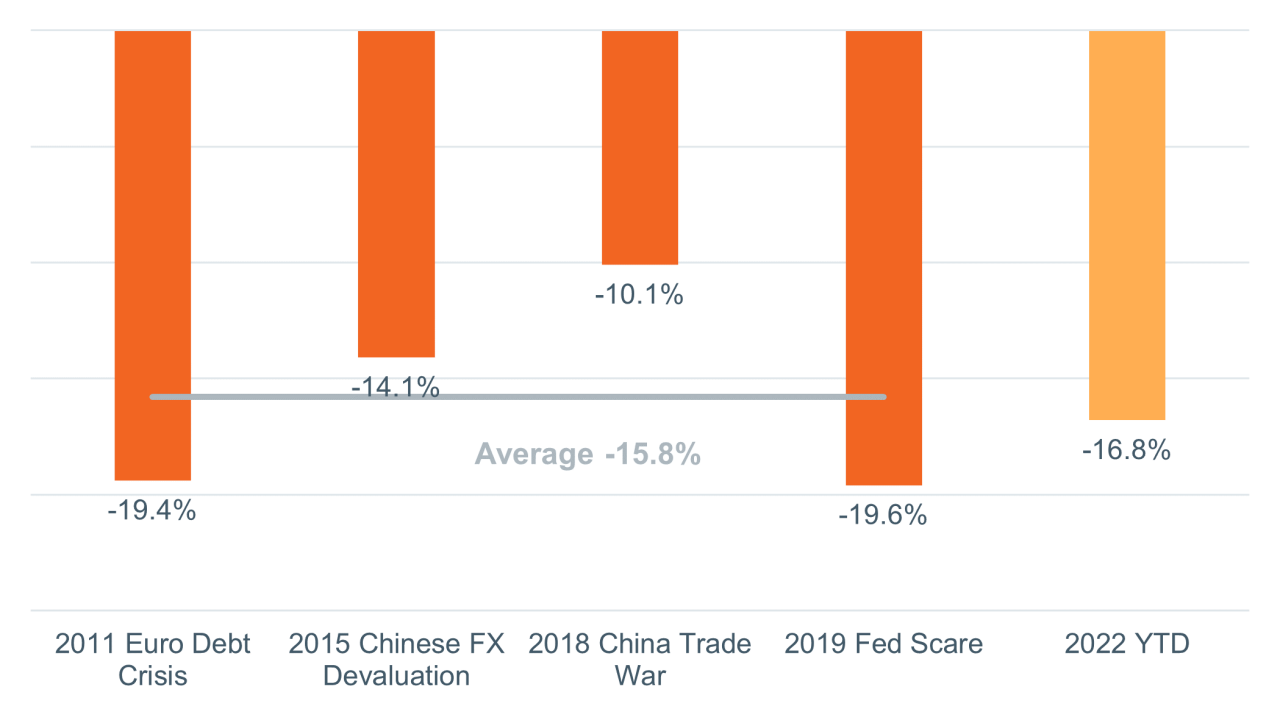
May 10, 2022—Weakness in the stock market has been acute. Over the past few weeks, there have been times when it seems that investors can’t find the exit fast enough. The CBOE Volatility Index has spiked again to around 35, indicating the options market expects heightened volatility. (The average reading on the VIX for 2021 was below 20.) But the S&P 500 index has now corrected 16.8% from its all-time high, a drawdown in line with the four non-recessionary growth scares of the prior expansion (Figure 1). Could we be getting close to a bottom? One contrarian signal suggests this could be the case, but we are advising patience before moving to an above-benchmark weight on equities.
To help you better navigate the current volatile market environment, we invite you to join us for our upcoming webinar, “Growth Scare or Recession?” on Thursday, May 12, at 11AM EST.
Figure 1: Current drawdown approaching average for prior growth scares
S&P drawdowns in prior growth scares

Sources: Bloomberg, WTIA. As of May 9, 2022.
Past performance cannot guarantee future results. Indexes are not available for direct investment. Investment in a security or strategy designed to replicate the performance of an index will incur expenses such as management fees and transaction costs which will reduce returns. Investing involves risks and you may incur a profit or a loss.
The answer to the question of whether stocks will soon find a bottom lies in whether we are experiencing a growth scare or the prelude to a legitimate recession. Despite a contraction in the first quarter, we do not anticipate a recession in the next 12 months. Yet investors and consumers alike are more pessimistic than at the onset of the pandemic. We have highlighted this stat on the consumer side in the May issue of our monthly flagship publication, and it could portend a slowdown in consumer spending.
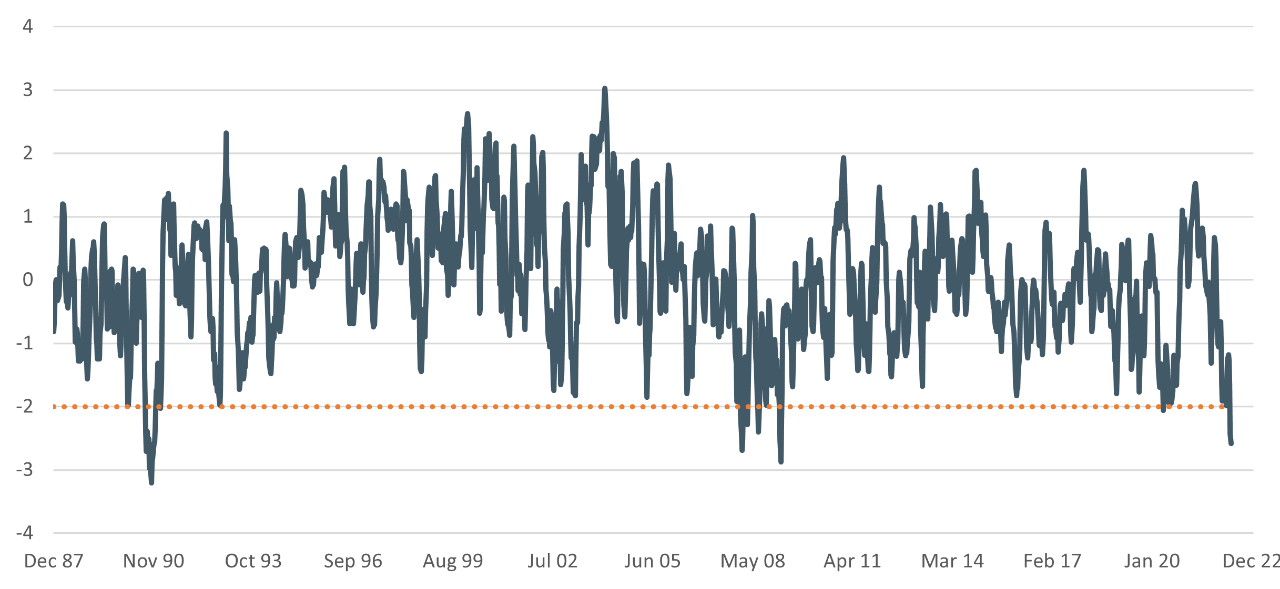
However, extremely negative investor sentiment is often necessary for stocks to find a bottom—a term often referred to as “capitulation.” This flush of investor sentiment is painful but can act as a contrarian signal. As evidence, we consider the survey of investor sentiment provided by the American Association of Individual Investors (AAII). It asks for a respondent’s view of the stock market over the coming six months as being bullish (positive), bearish (negative), or neutral. This survey is very noisy and not all that helpful on a week-to-week basis, but it can be very telling at the extremes. We looked at the four-week-moving average of the difference between the number of respondents who are bullish versus bearish (Figure 2). The latest reading is more than 2.5 standard deviations below the mean going back to 1987—a bearish threshold that has been breached only three other times historically. The average 12-month total return for the S&P 500 after this signal fell 2 or more standard deviations below the mean has been 14%, versus 11% annualized for the whole period.
Figure 2: Investor sentiment flashing red
AAII bullish-bearish sentiment survey

Sources: AAII, Bloomberg. As of May 4, 2022. Chart shows the difference between respondents indicating they are bullish on the stock market over the next six months minus those indicating they are bearish. Dashed line shows -2 standard deviations below the mean.
The AAII Investor Survey—along with other measures of sentiment like the amount of put (downside protection) versus call (expectation of a stock to move higher) option buying—provides an optimistic signal for long-term investors. This is not to say the bottom is in. Valuations for equities have contracted by 23% since the end of 2020 (as measured by the next-12-month price-to-earnings ratio of the S&P 500[1]), but forward-looking earnings estimates have yet to adjust meaningfully.
Core narrative
Prior growth scares had a catalyst to turn the market around, whether that was Chinese policymakers stepping in to support the yuan in 2016 or Chair Powell walking back hawkish intentions in 2019. This time the catalyst will likely need to come from decelerating inflationary readings. We could see core inflation start to decelerate as early as next month, but it would likely take several months after that for the trend to be confirmed and the Fed to adjust to a more dovish stance. For now, we retain a neutral allocation to U.S. and international developed equities versus our strategic benchmark. We are also underweight investment-grade fixed income but holding elevated levels of cash. Investors with excess liquidity who are working on getting invested should stick with their plan of deploying capital, with a possible acceleration of investments in coming weeks if weakness continues. Rebalancing can also be a powerful tool for long-term investors who are already fully invested, as a disciplined rebalancing benefits from buying into weakness and trimming back on winning asset classes.
[1] Source: Bloomberg, as of May 6, 2022.
Disclosures
Facts and views presented in this report have not been reviewed by, and may not reflect information known to, professionals in other business areas of Wilmington Trust or M&T Bank who may provide or seek to provide financial services to entities referred to in this report. M&T Bank and Wilmington Trust have established information barriers between their various business groups. As a result, M&T Bank and Wilmington Trust do not disclose certain client relationships with, or compensation received from, such entities in their reports.
The information on Wilmington Wire has been obtained from sources believed to be reliable, but its accuracy and completeness are not guaranteed. The opinions, estimates, and projections constitute the judgment of Wilmington Trust and are subject to change without notice. This commentary is for informational purposes only and is not intended as an offer or solicitation for the sale of any financial product or service or a recommendation or determination that any investment strategy is suitable for a specific investor. Investors should seek financial advice regarding the suitability of any investment strategy based on the investor’s objectives, financial situation, and particular needs. Diversification does not ensure a profit or guarantee against a loss. There is no assurance that any investment strategy will succeed.
Past performance cannot guarantee future results. Investing involves risk and you may incur a profit or a loss.
Indexes are not available for direct investment.
Reference to the company names mentioned in this blog is merely for explaining the market view and should not be construed as investment advice or investment recommendations of those companies. Third party trademarks and brands are the property of their respective owners.
S&P 500 index measures the performance of approximately 500 widely held common stocks listed on U.S. exchanges. Most of the stocks in the index are large-capitalization U.S. issues. The index accounts for roughly 75% of the total market capitalization of all U.S. equities.
Standard deviation is the measure of dispersion of a set of data from its mean. It measures the absolute variability of a distribution; the higher the dispersion or variability, the greater is the standard deviation and greater will be the magnitude of the deviation of the value from their mean.
Stay Informed
Subscribe
Ideas, analysis, and perspectives to help you make your next move with confidence.
What can we help you with today