Cash Investing Playbook: Whether, When, and How to Make Your Move
April 11, 2025
 Equal Housing Lender. © 2026 M&T Bank and its affiliates and subsidiaries. NMLS #381076. M&T Bank Member FDIC.

Institutional Services Insights
Wealth Management Insights
Who We Are
Log In
Select Business Area

Our Services
Institutional Services Insights
For many, the process of investing cash in financial markets is a gradual one. Cash, whether from salaries or pre-tax income, cascades each month into brokerage or retirement accounts. However, we meet with clients every day who have come upon a large amount of cash—perhaps an inheritance windfall, business liquidation proceeds, or even profits from a savvy investment. Investing a large sum of money can be very exciting but also quite stressful. When is the right time to invest a significant amount of capital that represents a large portion of one’s total net worth? Should it be done all at once, akin to jumping in a cold pool, or perhaps little by little, in equal chunks over time? The question is not a simple one to answer, and for many the decision is made harder by the post-pandemic surge in the stock market. It has historically been most profitable to get invested immediately, but we believe the right decision also depends on the client, the individual circumstances, and the risk tolerance. We explore these nuances below.
The Investors with a large sum of cash (as a percentage of their investable assets) are generally guided toward one of two strategies for deploying that dry powder into the market:
The reality is that, while a gradual strategy may alleviate buyers’ remorse, it has historically not been as profitable as investing all at once. Consider Figure 1, which looks at four different strategies for getting invested into a 60/40 stock/bond portfolio. All strategies invest the fixed income portion of the portfolio immediately, as bonds have historically held value or appreciated when equities sell off by 15% or more—the exact situation that investors try to avoid by easing into the market. The first strategy invests the remaining 60% of the portfolio in equities immediately, while the other three invest the equity portion in equal installments over a period of three, six, or twelve months (with the balance of the equity allocation at any given time sitting in cash). Over the years shown in Figure 1, investing the equity allocation all at once has resulted in better next-12-month performance than all other strategies 55% of the time, far outpacing the success rates of the more gradual approaches.
Figure 1: Historically, investing cash immediately has been the best strategy
Percent of the time each cash deployment strategy has been most profitable over a 12-month horizon
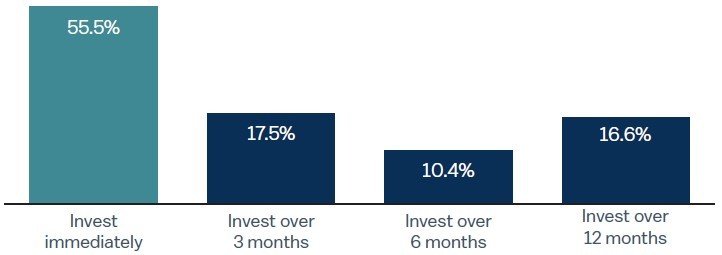
Data as of January 31, 2025.
Includes data starting January 1, 1989. Represents different strategies for investing cash into a 60/40 stock/bond portfolio, where stocks are represented by the S&P 500 Total Return Index, bonds are represented by the Bloomberg U.S. Aggregate Bond Index, and cash is represented by the Bloomberg Short Treasury Index.
Sources: Bloomberg, Standard & Poor’s, WTIA.
Usually, an investor who is hesitant to go “all in” on the market right away is concerned about losing money immediately after investing, perhaps as much as or more than his or her desire for short-term profits. We looked at the range of historical returns for each of these same cash deployment strategies (Figure 2). Though investing immediately has historically delivered the highest average return over a 12-month period, it has also come with the widest range of returns. It is this downside risk that may be reason for an investor to consider taking a more gradual approach if it alleviates some of the stress associated with getting invested. However, we would point out that the range of returns is dramatically reduced if the 12-month investment horizon is increased to three years (Figure 3).
Figure 2: All-at-once investing has reaped the widest 1-year return range
(12-month returns)
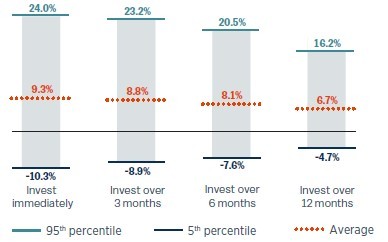
Figure 3: Longer term, each strategy delivers similar results
(3-year returns)
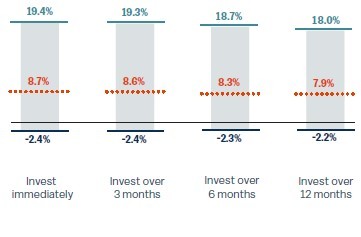
Data as of January 31, 2025.
Represents the average 12-month and 3-year return for each strategy, as well as the 5th and 95th percentiles for the data beginning January 1, 1989. Please refer to Figure 1 for detail on the indexes used to calculate the returns. Past performance is no guarantee of future results.
Sources: Bloomberg, Standard & Poor’s, WTIA.
The stock market has historically trended up, dwarfing very significant risk events over a long time horizon, so it has been beneficial to invest as much money as early as possible to take advantage of the power of compounding. Since 1989, at any given time the market has been higher six months later 77% of the time, and it has been higher twelve months later 84% of the time.
The current environment raises two additional and important issues:
On the first point, we would encourage you to keep a medium- to long-term investment horizon in mind. An honest assessment of your risk tolerance and goals resulting in a long-term strategic risk profile can help keep you focused on your long-term objectives, thereby avoiding the need to keep score of small wins or losses early in the game. Our proprietary wealth planning tool, Paragon™ (Portfolio Analysis, Risk Assessment & Goals Optimization), can be very useful in understanding the trade-offs between different risk profiles and asset allocations, analyzing market scenarios, and visualizing portfolio risk to help determine the right portfolio mix for a client’s unique goals.
The second point relates to an understandable reluctance to buy when the market has hit a new all-time high. Some will instead be convinced to wait for a pullback to enter the market at more attractive levels. The problem is that pullbacks are relatively rare occurrences, and since 1945, all-time highs for the S&P 500 have outnumbered pullbacks of 5% or more by a factor of 10 to 1. One could be left sitting on the sideline for months waiting for a pullback that ends up being less than the market’s return over that period.
Figure 4: Don’t be afraid of investing at all-time highs
S&P 500 12-month forward returns: all-time highs vs. non-all-time highs by stage of the business cycle
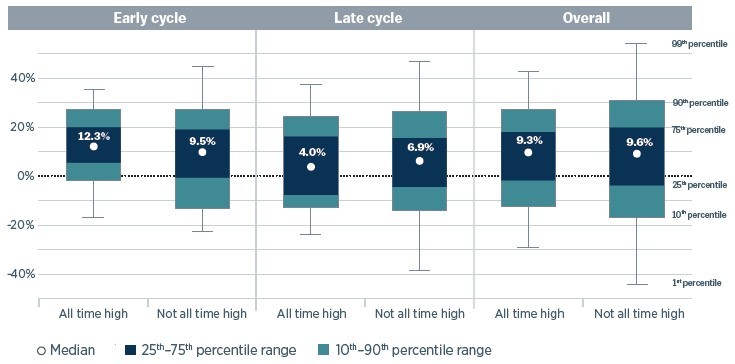
Figure 4 shows the distribution of S&P 500 forward 12-month price returns from days when the index hit all-time highs and all other trading days from 1928 through January 31, 2025, partitioned by stage of economic expansion. Early cycle and late cycle refer to the first and second half of expansions, characterized as periods between NBER-designated recessions. The right side shows the performance distribution for all observations.
Sources: National Bureau of Economic Research, Bloomberg and WTIA.
Forward return results will vary for time periods other than 12 months.
Past performance cannot guarantee future results. Indexes are not available for direct investment. Investment in a security or strategy designed to replicate the performance of an index will incur expenses such as management fees and transaction costs which will reduce returns.
On top of that, investing when the market hits an all-time high has historically been at least as successful as entering the market off its highs. This is particularly evident when the economy is in the first half of the economic cycle. Figure 4 (left side) shows that investing at an all-time high for the S&P 500 in the first half of an expansion (early cycle) has resulted in a median 12-month forward return of 11.7% compared to 9.7% for all other periods, using data going back to 1928. This doesn’t make an all-time high a buy signal, necessarily, but new highs tend to beget new highs and are not reason enough to sit on the sidelines.
The bottom line: A long-term strategic allocation that has accounted for an investor’s risk tolerance, return goals, and investment time horizon is designed to weather short-term market storms. That allocation may experience very similar performance over the initial three years, whether the cash is invested immediately or is tranched over a period of three, six, or twelve months, with historical experience giving a slight edge to an immediate investment (Figure 3). Should the fear of initial short-term losses from buying in at the market “top” be too much for a cash-holding investor to bear, then we would recommend investing that money over a relatively short period (three, six, or twelve months) according to a predetermined plan. In many cases, this will be a schedule determined at the outset, thereby avoiding turning a single difficult investment-timing decision into multiple agonizing decisions. We recognize that investing is difficult and personal, and we take very seriously the responsibility— and privilege—of guiding you through this process.
Please see important disclosures at the end of the article.
Please complete the form below and one of our advisors will reach out to you.
* Indicates a required field.
Stay Informed
Subscribe
Ideas, analysis, and perspectives to help you make your next move with confidence.
What can we help you with today