 Equal Housing Lender. © 2026 M&T Bank. NMLS #381076. Member FDIC. All rights reserved.
 Equal Housing Lender. © 2026 M&T Bank. NMLS #381076. Member FDIC. All rights reserved.
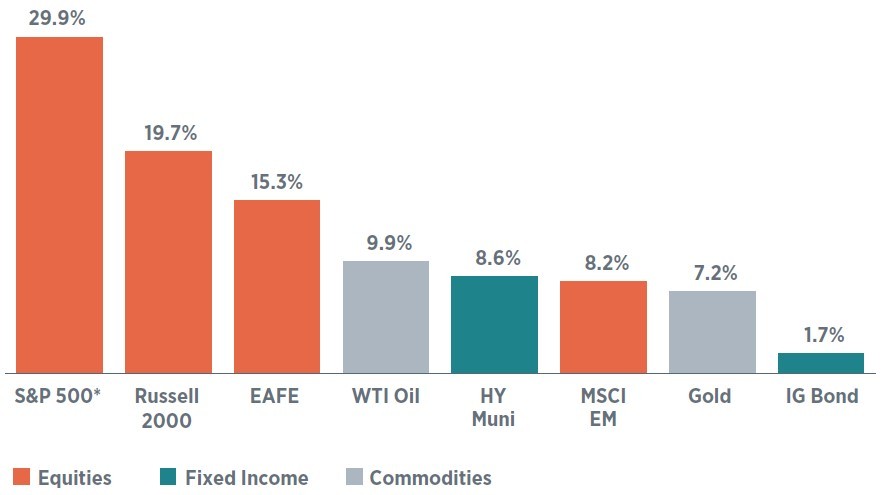
In some ways, the first quarter of 2024 represented a continuation of market trends observed last year. The S&P 500 maintained its strong bull run, gaining another 10% in the first quarter. This brings the 12-month total return to 30%—in the top decile going back to 2000. The momentum factor drove the market, meaning that the “winners” kept winning, while the “losing” stocks continued to underperform. The positive momentum extended outside of equities to commodities, notably crude oil and gold, the latter of which hit a new all-time high (in nominal terms; Figure 1).
Figure 1: U.S. equities still exhibiting momentum
12-month trailing total return (%)

Data as of March 31, 2024. Sources: Bloomberg, WTIA.
*All indices are defined in the glossary at the end of the article.
Investing involves risks, and you may incur a profit or a loss. Past performance cannot guarantee future results. Indices are not available for direct investment. Investment in a security or strategy designed to replicate the performance of an index will incur expenses such as management fees and transaction costs which will reduce returns. There is no assurance that any investment strategy will be successful.
Important shifts in the market have occurred, however they have been beneath the market’s surface. As expected, the Magnificent Seven has broken apart, though perhaps in more spectacular fashion than we anticipated. Nvidia and Meta finished the quarter among the S&P 500’s 10 best-performing companies, while Tesla was the worst-performing stock in the entire index. Value stocks started to make a comeback, particularly in the month of March, and the energy sector outperformed the technology sector for the quarter. We expect a broadening of market leadership to continue this year, though volatility could increase.
The narrative that drove markets in the first quarter—investors adjusting Fed expectations, alongside sticky inflation and robust economic growth—is likely to shift as we move toward the middle of the year. We expect the second quarter to be defined by two related themes: 1) U.S. economic growth settling in around 2% for the balance of the year; and 2) the start of a global monetary policy easing cycle. This environment is constructive for risk assets, though current valuations suggest a lot of good news is already priced. We maintain a full equity allocation and are patiently waiting to add to risk on market pullbacks.
After seven months of very well-behaved inflation data, the first quarter delivered an inflationary hiccup. Core inflation surprised to the upside in January and stayed elevated in February and March. Many, including ourselves and Fed Chair Powell, recognize that this resurgence was more likely than not the work of poor statistical adjustments to post-Covid seasonality trends than true price pressures.
Meanwhile, the U.S. continues to prove itself to be among the strongest and most resilient economies in the world. As an example, the Atlanta Fed GDPNow is tracking 2.8% growth for the first quarter on strong consumer spending, sentiment, and job data. The combination of disappointing inflation data and robust economic data in the first quarter pushed out the market’s projected timeline for the start of the Fed’s easing cycle.
At the start of the year, the fed funds futures market was pricing in more than six cuts of 25 basis points, or bps (0.25%), with the markets now pricing in even less than the Fed’s median projection of 75 bps of easing in 2024. Surprisingly, this hawkish adjustment to market expectations occurred without any material increase in equity volatility, even as the 10-year Treasury yield backed up more than 30 bps. The market’s orderly digestion of a more hawkish short-term Fed outlook mitigates a key risk heading into the year and is constructive for risk assets.
We continue to expect the Fed to cut rates by at least 100 bps this year, beginning in June. As inflation recedes, the Fed’s current policy will become increasingly restrictive. It has become clear to us that a weak economy is not necessary to bring down inflation. Productivity is increasing, driven in part by adoption of technology, including artificial intelligence, which is helping to offset companies’ input costs. We are not surprised that Chair Powell and the rest of the Fed are guiding markets toward a higher policy rate by maintaining somewhat hawkish rhetoric, but we think by midyear it will become clear that the Fed can cut by at least 100 bps, as well as slow or even end quantitative tightening.
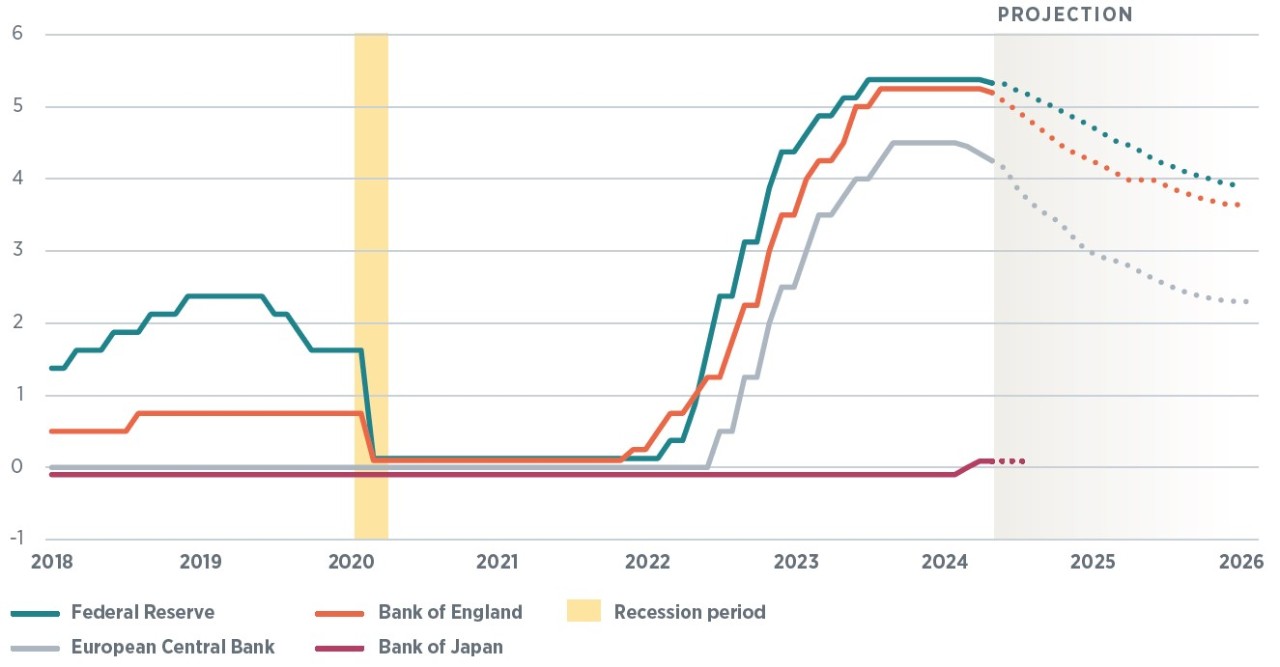
Figure 2: Global economy to enter sychronized easing cycle
Global policy rates (%)

Data as of March 31, 2024.
Sources: Bloomberg, WTIA.
Global policy rates are represented by the midpoint of the range (i.e., 5.3275% for the Fed's current rate). Projections denoted by the dotted line and calculated using central bank futures contracts. Bank of England contracts are provided quarterly and calculated using interpolation for maturities not provided.
We predict that a different, positive narrative will emerge in the second quarter, driven by two important themes. First, after a series of very robust U.S. GDP prints (4.9% in the third quarter of 2023, 3.4% in the fourth quarter, and tracking close to 3% for the first quarter of 2024), the U.S. economy will settle into a trend-like rate of growth of around 2% that will carry through the balance of the year. This more moderate, sustainable rate of growth will result from a slower consumer but one that continues to be supported by positive real wage growth and a moderating but still-healthy labor market. Certain cohorts of the income spectrum have finally spent down Covid-related excess cash and are facing elevated borrowing costs. The services economy should continue to expand, while the long-beleaguered manufacturing sector is showing signs of bottoming. A “Goldilocks” rate of growth, rather than a more robust expansion, is key to avoiding a second wave of inflation.
Second, we expect that the second quarter will be the beginning of a global monetary policy easing cycle extending beyond the Fed to other developed and developing economies’ central banks. We outlined our Fed expectations above, and a slew of other major central banks are expected to ease in tandem (Figure 2). The Swiss National Bank has already cut rates, and we expect the European Central Bank, Bank of England, and People’s Bank of China to follow suit. Aside from a few emerging markets central banks and the Bank of Japan (which just last month raised interest rates, the final central bank to abandon negative interest rate policy), the global economy will be entering a synchronized easing cycle this year that could extend into 2025.
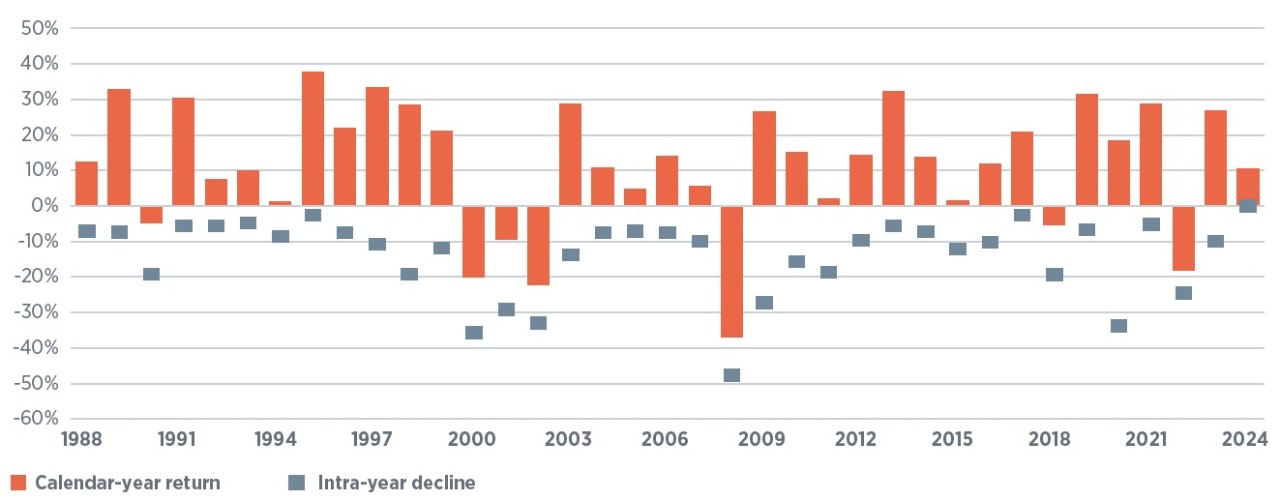
Figure 3: Equity volatility is normal
Historic S&P 500 calendar-year returns, maximum drawdowns, and one-year forward return

Data as of March 31, 2024.
Sources: Bloomberg, WTIA.
Investing involves risks, and you may incur a profit or a loss. Past performance cannot guarantee future results. Indices are not available for direct investment. Investment in a security or strategy designed to replicate the performance of an index will incur expenses such as management fees and transaction costs which will reduce returns. There is no assurance that any investment strategy will be successful.
These two themes create a constructive setup for risk assets; however, much of this good news appears to be already reflected in current valuations for U.S. large-cap equities. We are now positioned with a full allocation to equities, including U.S. large cap. We expect that returns over the next 12 months for the S&P 500 index, as well as the stocks that have driven most of the gains over the prior 12 months, will be positive but more modest in magnitude. At the same time, with valuations as full as they are, it would not take much of a catalyst for a market correction. Given our positive U.S. economic outlook, we expect any pullback to be short, shallow, and represent a buying opportunity. The average equity market pullback in any given year is approximately 12% (Figure 3). While we are not counting on a pullback of this magnitude, we expect that patience will be rewarded.
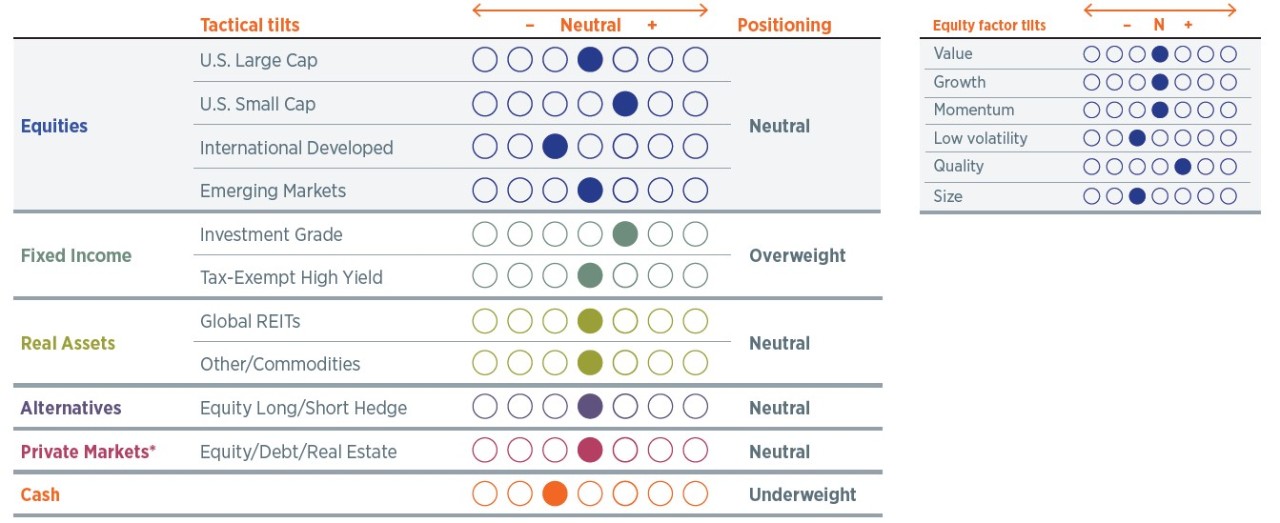
Luckily, we are finding opportunities in less-loved parts of the market, including some cyclical sectors, the value factor, and small-cap equities. We are not negative on megacap tech, but we think a trend-like rate of economic growth, easing from the Fed, and shifting of investor sentiment will result in a broadening of equity leadership. We hold a modest overweight to U.S. small-cap equities (Figure 4) and are eyeing opportunities in international equities should global economic and manufacturing momentum continue to improve. Signs of life may be emerging in Germany’s export-driven economy, as well as China’s manufacturing sector. We also continue to hold a modest overweight to investment-grade fixed income, which should act as a hedge against a market correction. Finally, we see attractive total return prospects from fixed income should the yield curve steepen, and long-dated yields remain around 4.25% for the 10-year.
Figure 4: Assset class positioning
High-net-worth portfolios with private markets*

* Private markets are only available to investors that meet Securities and Exchange Commission standards and are qualified and accredited. We recommend a strategic allocation to private markets but do not tactically adjust this asset class.
Data as of March 31, 2024.
Positioning reflects our monthly tactical asset allocation (TAA) versus the long-term strategic asset allocation (SAA) benchmark. For an overview of our asset allocation strategies, please see the disclosures.
Please see important disclosures at the end of the article.
Please see important disclosures at the end of the article.
Stay Informed
Subscribe
Ideas, analysis, and perspectives to help you make your next move with confidence.
What can we help you with today