 Equal Housing Lender. Bank NMLS #381076. Member FDIC.
 Equal Housing Lender. Bank NMLS #381076. Member FDIC.
August was meant to be lazy and easy. Inflation slowed, the Federal Reserve (Fed) hiked again (which was widely expected), corporate earnings were solid enough to not be scary, and markets were taking the U.S. government’s refunding in stride. But investors rarely have the luxury of remaining comfortable for very long, and bond markets played the part of spoiler last month. A series of events drove the 10-year yield to its highest level in nearly 16 years, leading to the worst monthly performance of large-cap stocks this year, according to the S&P 500. The crucial questions are “Why?” and “Where does it go from here?” We’ve recently moved to a more constructive outlook for the U.S. economy but see continuing recession risk, which, along with high valuations, is mainly why we maintain our underweight to stocks. We also think long-term interest rates are more likely to move back down than up, bolstering our case for our current overweight to core fixed income.
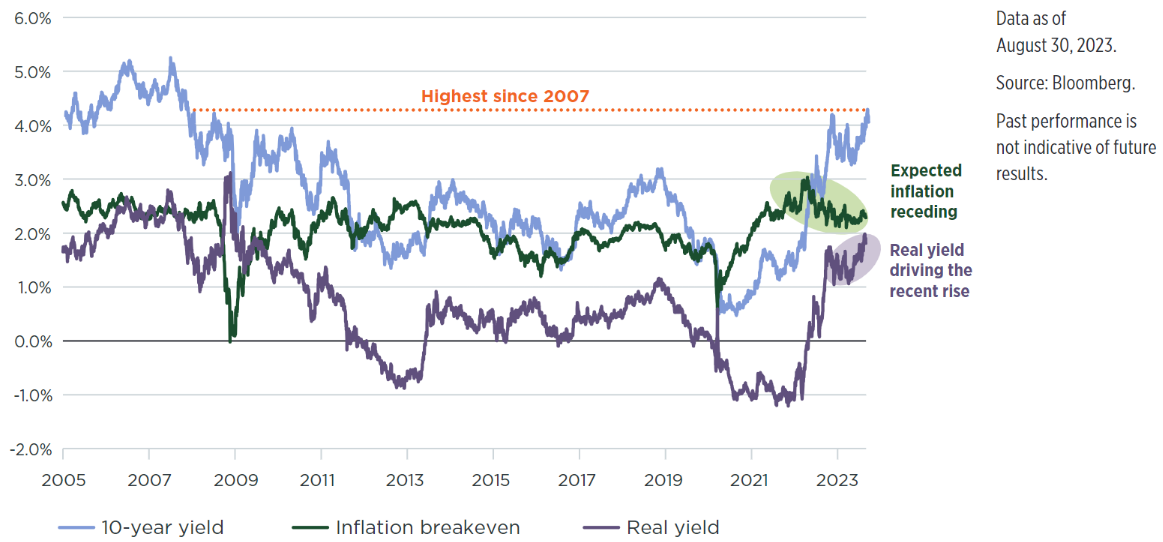
After spending most of the past year drifting in a range of 3.75%–4%, last month’s bond market selloff sent the 10-year yield to its highest level since October of 2007, which was almost a full year before the failure of Lehman Brothers and the onset of the GFC, or global financial crisis (Figure 1). There were three market developments that led directly to the shift in sentiment last month: an upside surprise in planned borrowing by the U.S. Treasury, Fitch’s downgrade of U.S. government debt, and a move by Japan’s central bank that pushed that country’s sovereign yields higher.
Figure 1:
Highest bond yields in 16 years
U.S. 10-year Treasury yield and components (%)

That the U.S. government needed to borrow heavily was a surprise to no one. The Treasury had depleted its cash reserves by the time of the June 2023 debt ceiling agreement, and those reserves needed to be rebuilt. The increased borrowing had gone smoothly until July 31 when the government said it planned to borrow $1 trillion in 3Q, sharply higher than the $733 billion it had estimated just three months earlier, triggering selling pressure in longer-term Treasuries.
Fitch, the rating agency, compounded the selling pressure a few days later when it downgraded the U.S. government’s credit rating (as discussed in a recent Wilmington Wire blog post) to AA+ from AAA, citing “the expected fiscal deterioration over the next three years, a high and growing general government debt burden, and the erosion of governance relative to AA- and AAA-rated peers over the last two decades that has manifested in repeated debt limit standoffs and last-minute resolutions.” This was, in layman’s terms, what everyone already knows, that Congress hasn’t shown a willingness or ability to get its long-term borrowing under control. It’s practically the same thing S&P said in August 2011 when it made the same move, making Fitch’s decision appear laughably anticlimactic. Nevertheless, Fitch’s move contributed to the selloff.
The third development came from abroad. The Bank of Japan (BoJ) loosened its grip on that country’s interest rates by relaxing its yield curve control (YCC) policy that has been in place since 2016. In an effort to boost growth and inflation, the BoJ has been holding the 10-year yield at 0%, which has in turn driven Japanese fixed income investors more toward U.S. securities. The BoJ’s adjustment last month makes its local bonds more attractive on the margin, and drives investors from the U.S. back to Japan, pushing U.S. yields higher. While each of these three events is very real and not expected to reverse, we do think the market has likely overreacted, pushing yields a bit too high.
Figure 2:
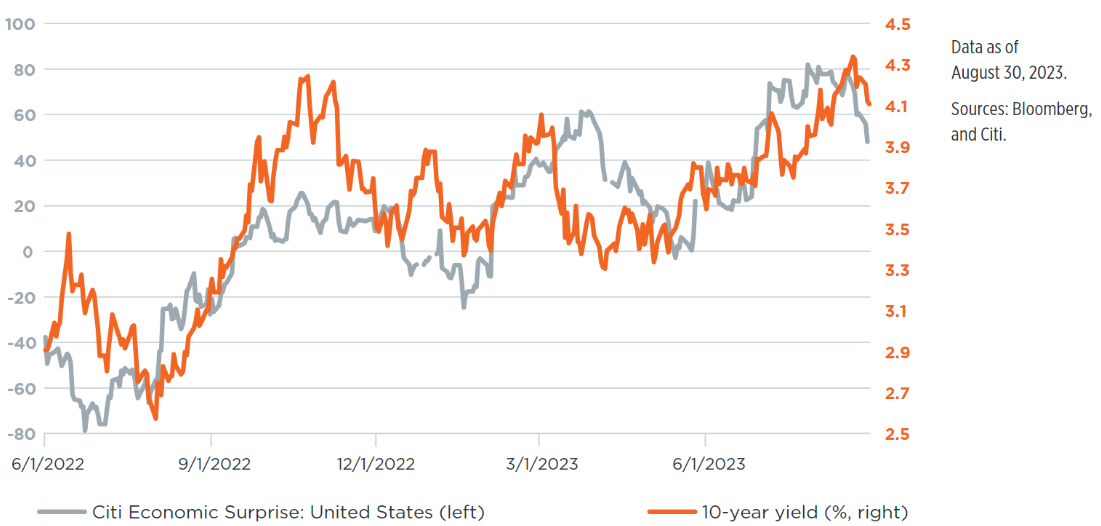
U.S. economic data keep surprising to the upside helping drive rates higher
U.S. Citi Surprisie Index and 10-year yield; Atlanta Fed GDPNow tracker

Another way to look at Treasury yields is to break them down into two components. Thanks to the existence of Treasury inflation-protected securities (TIPS), it is straightforward to see how much of a Treasury yield is compensating investors for inflation, with the remaining return representing the real yield. And both components reflect a combination of investors’ expectations as well as uncertainty surrounding those projections.
Expectations for 10-year inflation peaked well over a year ago, in April 2022, ticking above 3% for the first time in the 25-year history of the data. That was when consumer prices were ramping up and the Fed was in the early stages of its campaign to rein in those pressures. Since that time, investors have been calmed by decelerating inflation, and expectations have declined to more normal levels, around 2.4% in August.
It has been the real yield driving the most recent surge in Treasury rates and which can be seen as a proxy for economic growth, as well as the uncertainty around future growth levels. The U.S. economy continues to defy gravity with strong consumer spending, a possible bottoming out of the housing sector, decent capital expenditure projections, and solid job growth. To wit, the Citi U.S. Economic Surprise Index has been on a steady positive march upward since May 2023, and the Atlanta Fed’s GDPNow tracker is currently calling for stronger than 5% growth in 3Q 2023 (Figure 2). This is all in spite of the swift increase in interest rates over the past year and a shock to the U.S. banking system in early 2023.
Figure 3:
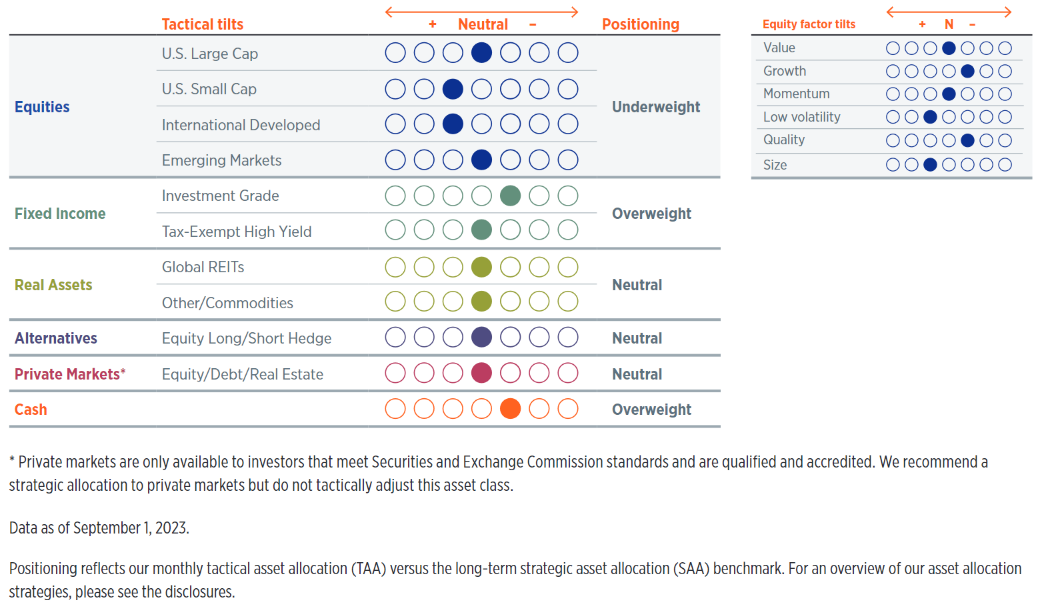
Current positioning
High-net-worth portfolios with private markets*

While the strong economic data may seem to be unambiguously good news, there is a downside. The rise in real yields is reflecting strong economic growth but also the possibility of more rate hikes and a sustained plateau for rates from the Fed to accompany that significant expansion. One interpretation of the full breakdown shown in Figure 1 is that the U.S. economy has returned not to a pre-Covid-state, but a pre-GFC-state, when growth was higher, but so was inflation, as well as the entire yield curve. The pain endured by equities in August could be less a recession signal as much as it is a sad farewell to the low-rate environment that endured and relentlessly supported stocks for a decade before Covid.
We do think fixed income markets may have overreacted to this recent spate of strong economic data. Although we have recently upgraded our outlook—moving to a baseline expectation of a soft landing and the U.S. avoiding recession—we do not expect a no landing scenario, where the economy simply remains strong. The environment is too challenging for that. High rates are weighing on firms’ capex plans and also on consumer spending. Additionally, consumers have spent down the bulk of their dry powder, or cash reserves. Along with the soft landing, we’re still looking at a below-trend economy in the 1%–2% growth range. As that plays out in the data, we expect to see some relief with longer-term rates drifting back down. Indeed, a handful of data releases late in the month supported our view, pushed rates back down a bit, giving a boost to equities.
Given all the uncertainty, we are maintaining our current, mildly defensive position in portfolios. We hold a modest underweight to equities versus our long-term strategic asset allocation target, specifically within U.S. small cap and international developed equities. We think our full allocation to U.S. large cap remains appropriate and have been encouraged by its overall strong performance this year (Figure 3).
We hold an overweight to core fixed income. That asset class suffered losses in August due to the rate movements described above, but losses were worse in equities, so this relative positioning was advantageous. We expect rates to come down over our nine- to 12-month tactical horizon as economic growth expectations recede a bit, so this overweight should be additive. We also hold a small overweight to cash that we expect to deploy in future months.
Stay Informed
Subscribe
Ideas, analysis, and perspectives to help you make your next move with confidence.
What can we help you with today