Equal Housing Lender. © 2026 M&T Bank and its affiliates and subsidiaries. NMLS #381076. M&T Bank Member FDIC.
Institutional Services Insights
Wealth Management Insights
Who We Are
Log In
Select Business Area
Our Services
Institutional Services Insights
Federal Reserve (Fed) Chair Kevin Warsh’s hotly anticipated speech in Jackson Hole last week lifted some of the fog that surrounded his view of the economy and the Fed itself, ultimately generating high expectations of an interest rate hike at the upcoming Federal Open Market Committee (FOMC) meeting on September 16. While we would not be surprised if the group raised interest rates, we expect them to hold off and await more data, ultimately reducing rates in coming months. If the FOMC does raise rates, we expect that would be undone in coming months with a rate cut, and then more reductions thereafter.
We do not see the economy as strong as Chair Warsh does. Capital Expenditures (capex) are indeed strong for the Artificial Intelligence (AI) industry, but much tamer otherwise. Construction outside of the AI buildout is weak, and consumer spending is not as rosy as the overall figures suggest. Critically, we don’t see the multi-year run of inflation above the Fed’s target as driven by consumer strength. We see it as caused initially by statistical factors with lags in shelter inflation (from roughly 2022 to 2024) and then by the successive shocks of tariffs and energy prices. Raising rates would only compound the challenges facing consumers.
Ultimately the path of the economy will determine the path for rates. We see a slowing economy, decelerating inflation, and continued slow job growth. Each of those argue for lower interest rates going forward, which should be supportive of risk assets and our current overweight to equities.
AI is driving capex
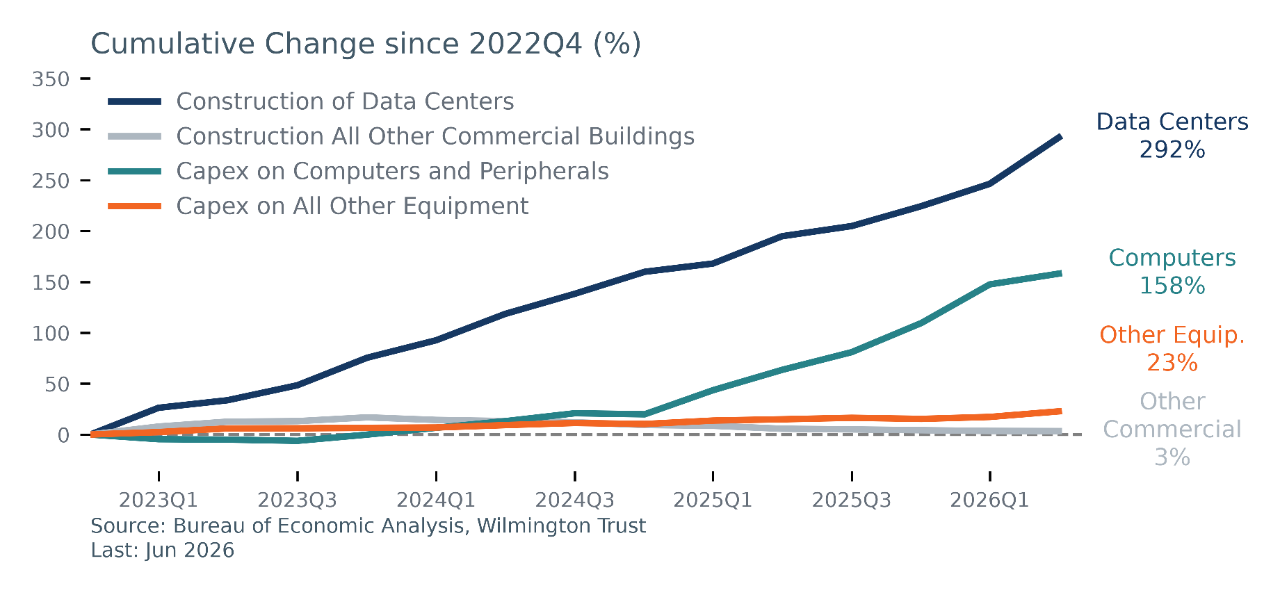
Chair Warsh described business capex as strong, but we see too much reliance on the AI buildout and pervasive weakness otherwise. Warsh cited the near-9% year-over-year (y/y) growth in equipment, software, and research & development through 2026Q2. The figure is accurate and driven significantly by investment in computers, servers, and related equipment, an ongoing dynamic since the release of Chat GPT in late 2022. Since then, capex on computing equipment is up a staggering 158% (Figure 1). Capex on all other equipment is up 23% over 14 quarters, about 6.1% annualized.
Warsh omitted nonresidential construction when citing capex. Spending on commercial buildings has declined for 10 consecutive quarters despite surging spending on data centers. Spending on non-data center commercial real estate rose for a year after the release of ChatGPT but has since been crowded out. The details inside “Other Commercial” are sobering. Construction of commercial buildings is down 24% since its peak in September 2023. Office construction is down similarly (-25%) since its August 2023 peak, and manufacturing has had the biggest pullback, down 32% after a September 2024 peak. This might not be so terrible a development if it reflects a structural shift to an economy that uses more AI and fewer workers, thereby requiring less traditional space. But we are doubtful that the shift can happen this quickly and we think the AI boom is masking weakness in other sectors.
Figure 1: Construction and Capex Outside of AI Are Weak
What are consumers buying?
One implication of Warsh’s speech is that he sees the overshoot of inflation as caused by strong consumer demand. After all, Fed policy works by stimulating or suppressing demand, not by influencing supply. When FOMC members say they may need to raise rates, they are saying that demand is too strong and is stoking inflation. A close look at the details of spending data suggests otherwise.
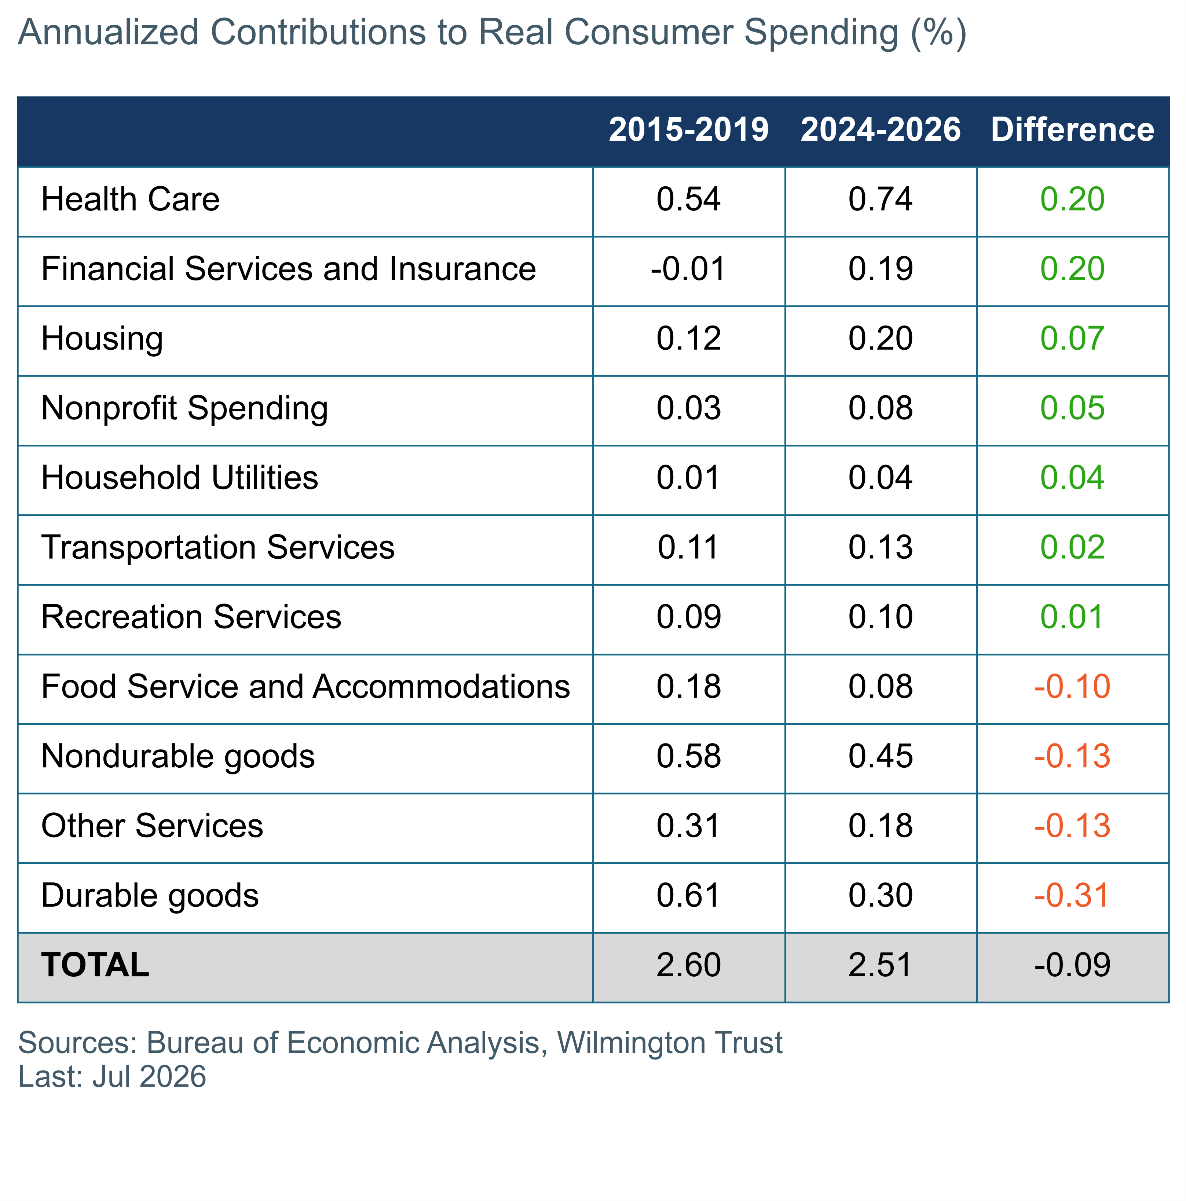
For all the ink that has been spilled on who is doing the spending in the “K-shaped” economy of high- and low-income households, considerably less has been used to show what consumers are buying. The aggregate measure of inflation-adjusted spending looks healthy enough at 2.1% y/y in July 2026, but the details are less encouraging. Figure 2 compares the annualized contributions by spending category from the five years before the pandemic to the past 2.5 years.
Health care spending has contributed 0.74% to overall growth in the recent time frame, about 0.2% higher than in the earlier period. While health care spending is an important economic contribution, it is a staple, is mostly paid for by private and government insurance, and does not signal consumer strength.
The contribution from financial services is even less exciting, as the category is not a sign of buoyant shopping moods. Additionally, the data for the category is more alchemy than science, as much of it is derived or “imputed.” For instance, much of the “services furnished without payment” such as check processing, clearing and other services performed by banks, is not tracked directly but instead concocted using interest rate spreads. “Portfolio management fees” aren’t explicitly counted either but are instead a function of financial markets rising and are likely overcounting the amount of “spending” on such services as well as the pricing.
The data also shows that categories that one might think of as signaling healthy consumers (restaurants, hotels, goods, and an array of catch-all services) are seeing much less spending in this cycle than in the past. This fits with our core narrative that consumers have reacted to high tariff and energy costs by pulling back on spending in other areas. That is why as tariffs drove up the prices of goods last year, prices of services decelerated. It is also why high gasoline prices have yet to stoke a reaction in core inflation.
Figure 2: Spending Strength from Consumer Staples
Why has inflation been above target for 5 years?
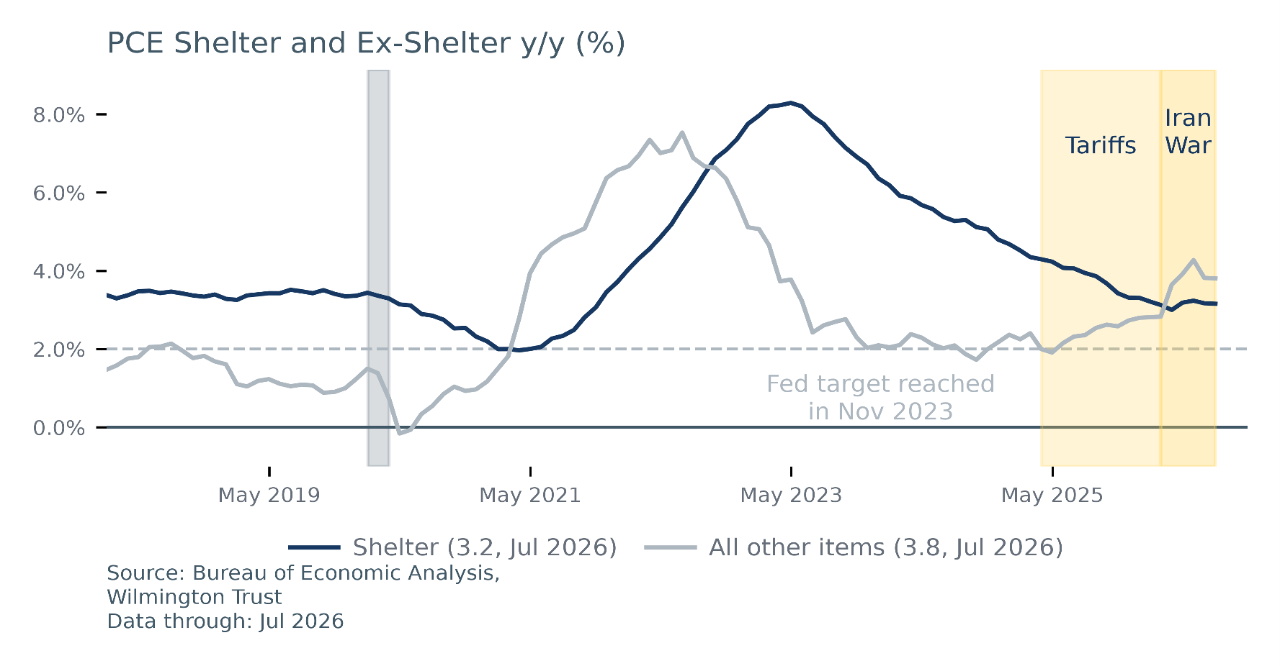
The most common refrain when discussing the Fed these days is that inflation has been above the 2% target for five years. Chair Warsh frequently cites it, it is entirely true, and it is the driving force behind the hawkish turn at the Fed. However, we don’t see that as evidence of strong consumer demand that needs to be tamped down with higher interest rates. Most of the problem comes from a statistical oddity with shelter data and then from tariffs and energy prices.
The post-Covid high-inflation episode is well-known and featured supply chain issues along with a surge in consumer spending thanks to pent-up demand, stimulus checks, generous unemployment insurance, and a surge in wages. Excluding shelter, inflation surged above 7% but then fell back to the Fed’s target over the course of 2023 as supply and demand normalized. Shelter, however, is a special case. The official inflation data for the cost of homeownership or apartments behaves much differently than observable market data, such as home prices from National Association of REALTORS, or rental rates from Zillow. Market data showed home prices and rents returning to moderate growth rates by the end of 2023, but the official inflation series took more than a year longer to normalize. That oddity in the shelter calculations kept overall inflation figures above the Fed’s target even as prices for routine purchases of goods and services had fully normalized. Then, just as the shelter indices were normalizing, the economy was hit with a tariff shock in 2025 and now an energy price shock in 2026, driving the ex-shelter basket higher.
We’re not arguing with the fact that PCE inflation has been above the Fed’s target for five years. That is an unarguable observation of the data. We are saying we don’t attribute the overshoot to an excess of consumer demand that now needs to be extinguished by higher interest rates. We attribute it to a multiyear statistical oddity for shelter and two distinct policy shocks, none of which will be solved with tighter monetary policy.
Figure 3: Inflation is not as stubborn as the market narrative
What will the Fed do?
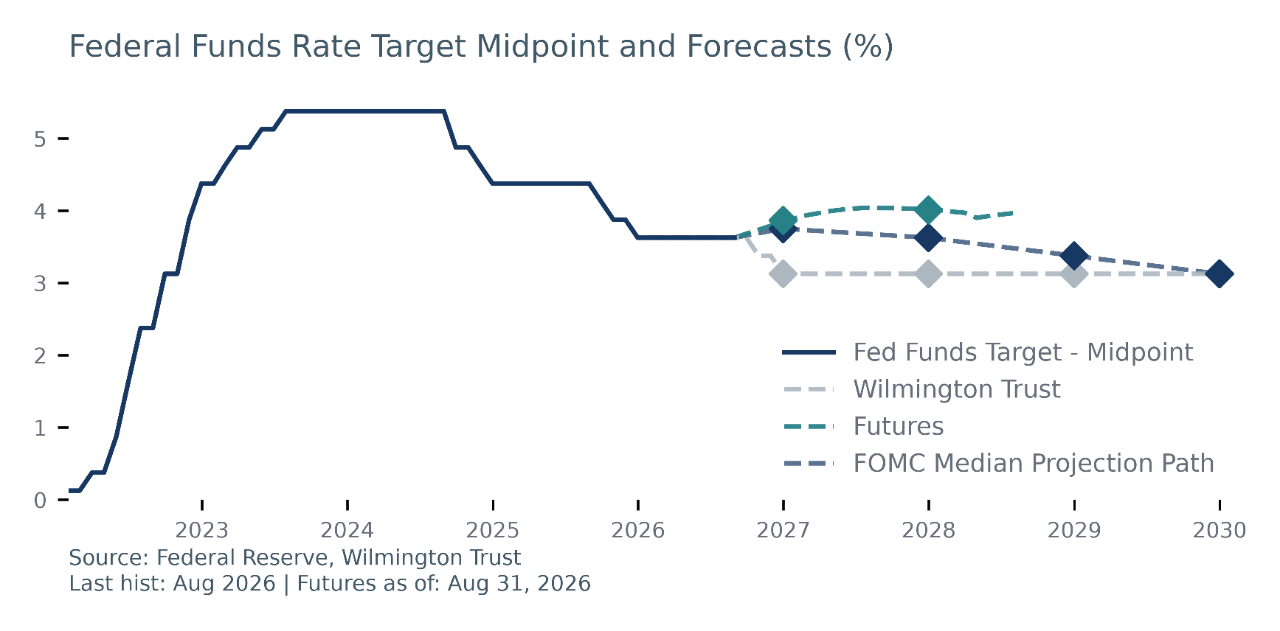
Our assessment of capex, consumer spending and inflation is different from that of Chair Warsh and a growing number of Fed officials. We do not think rate hikes are necessary, but our difference of opinion is meaningless in the near term. Chair Warsh’s speech in Jackson Hole increases the odds of a rate hike at the upcoming FOMC meeting on September 16. Several other voters have voiced support for a rate hike. The two remaining significant data releases (Employment Situation Sept. 4, Consumer Price Index Sept. 11) will likely be the determining factors, and we expect both to be on the weaker side and convince the committee to hold rates unchanged. That said, we would not be surprised if the FOMC raises rates at this upcoming meeting.
Looking further out, we expect the labor market and inflation data to continue coming in on the low side and ultimately lead to rate cuts over the next year. Should the FOMC decide to raise rates in September, we expect the next move would be to reduce rates, nullifying that increase, and then more rate cuts thereafter. Simply put, we expect inflation to continue decelerating and for job creation to remain weak, both of which argue for lower rates.
Figure 4: We expect lower rates over the next year
Core Narrative
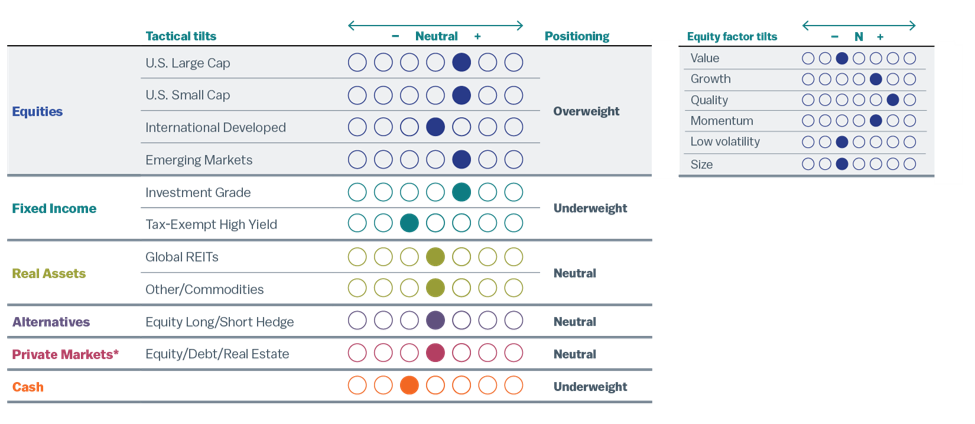
The equity market has performed well since our decision to add to risk assets midyear. That strong performance was helped by a robust earnings season. One of the components of our outlook is that the Fed will be reducing rates over the next year driven by mild core inflation pressure, which would be supportive of risk assets. That has been muddied a bit by Chair Warsh’s speech as well as other FOMC members arguing for rate hikes. As described, we think rates will ultimately move lower over the next year even if the group decides to raise rates in September. We see the economy as strong enough to avoid recession yet not strong enough to drive inflation higher. That outlook, combined with continued earnings growth, should be supportive of risk assets and our positioning going forward (Figure 5).
Figure 5: Current Positioning
Data as of June 30, 2026. Positioning reflects our monthly tactical asset allocation (TAA) versus the long-term strategic asset allocation (SAA) benchmark. For an overview of our asset allocation strategies, please see the disclosures.
*Private markets are only available to investors that meet Securities and Exchange Commission standards and are qualified and accredited. We recommend a strategic allocation to private markets we do not tactically adjust this asset class.
Definitions
A K-shaped economy occurs when different parts of the economy move in opposite directions at the same time. Some individuals, industries, or businesses prosper and grow, while others struggle or fall further behind. The pattern resembles the letter "K", with one line moving upward and the other downward.
Disclosures
Facts and views presented in this report have not been reviewed by, and may not reflect information known to, professionals in other business areas of Wilmington Trust or M&T Bank who may provide or seek to provide financial services to entities referred to in this report. M&T Bank and Wilmington Trust have established information barriers between their various business groups. As a result, M&T Bank and Wilmington Trust do not disclose certain client relationships with, or compensation received from, such entities in their reports.
The information on Wilmington Wire has been obtained from sources believed to be reliable, but its accuracy and completeness are not guaranteed. The opinions, estimates, and projections constitute the judgment of Wilmington Trust and are subject to change without notice. This commentary is for informational purposes only and is not intended as an offer or solicitation for the sale of any financial product or service or a recommendation or determination that any investment strategy is suitable for a specific investor. Investors should seek financial advice regarding the suitability of any investment strategy based on the investor’s objectives, financial situation, and particular needs. Diversification does not ensure a profit or guarantee against a loss. There is no assurance that any investment strategy will succeed.
Past performance cannot guarantee future results. Investing involves risk and you may incur a profit or a loss.
Indexes are not available for direct investment. Investment in a security or strategy designed to replicate the performance of an index will incur expenses such as management fees and transaction costs which will reduce returns.
References to specific securities are not intended and should not be relied upon as the basis for anyone to buy, sell, or hold any security. Holdings and sector allocations may not be representative of the portfolio manager’s current or future investment and are subject to change at any time.
Reference to the company names and/or securities mentioned in this blog is merely for explaining the market view and should not be construed as investment advice or investment recommendations of those companies and/or securities. Third party trademarks and brands are the property of their respective owners.
Any investment products discussed in this commentary are not insured by the FDIC or any other governmental agency, are not deposits of or other obligations of or guaranteed by M&T Bank, Wilmington Trust, or any other bank or entity, and are subject to risks, including a possible loss of the principal amount invested.
Some investment products may be available only to certain “qualified investors”—that is, investors who meet certain income and/or investable assets thresholds.
Alternative assets, such as strategies that invest in hedge funds, can present greater risk and are not suitable for all investors.
An Overview of Our Asset Allocation Strategies
Wilmington Trust offers seven asset allocation models for taxable (high-net-worth) and tax-exempt (institutional) investors across five strategies reflecting a range of investment objectives and risk tolerances: Aggressive, Growth, Growth & Income, Income & Growth, and Conservative. The seven models are High Net Worth (HNW), HNW with Liquid Alternatives, HNW with Private Markets, HNW Tax Advantaged, Institutional, Institutional with Hedge LP, and Institutional with Private Markets. As the names imply, the strategies vary with the type and degree of exposure to hedge strategies and private market exposure, as well as with the focus on taxable or tax-exempt income. On a quarterly basis we publish the results of all of these strategy models versus benchmarks representing strategic implementation without tactical tilts.
Model Strategies may include exposure to the following asset classes: U.S. large-capitalization stocks, U.S. small-cap stocks, developed international stocks, emerging market stocks, U.S. and international real asset securities (including inflation-linked bonds and commodity-related and real estate-related securities), U.S. and international investment-grade bonds (corporate for Institutional or Tax Advantaged, municipal for other HNW), U.S. and international speculative grade (high-yield) corporate bonds and floating-rate notes, emerging markets debt, and cash equivalents. Model Strategies employing nontraditional hedge and private market investments will, naturally, carry those exposures as well. Each asset class carries a distinct set of risks, which should be reviewed and understood prior to investing.
ALLOCATIONS:
Each strategy group is constructed with target policy weights for each asset class. Wilmington Trust periodically adjusts the policy weights target allocations and may shift away from the target allocations within certain ranges. Such tactical adjustments to allocations typically are considered on a monthly basis in response to market conditions. The asset classes and their current proxies are:
• Large–cap U.S. stocks: Russell 1000® Index
• Small–cap U.S. stocks: Russell 2000® Index
• Developed international stocks: MSCI EAFE® (Net) Index
• Emerging market stocks: MSCI Emerging Markets Index
• U.S. inflation-linked bonds: Bloomberg US Treasury Inflation Notes TR Index Value Unhedged USD (took effect 8/1/22)
• International inflation-linked bonds: Bloomberg World ex US ILB (Hedged) Index
• Commodity-related securities: Bloomberg Commodity Index
• U.S. REITs: S&P US REIT Index
• International REITs: Dow Jones Global ex US Select RESI Index
• Private markets: S&P Listed Private Equity Index
• Hedge funds: HFRX Global Hedge Fund Index (took effect 8/1/22)
• U.S. taxable, investment-grade bonds: Bloomberg U.S. Aggregate Index
• U.S. high-yield corporate bonds: Bloomberg U.S. Corporate High Yield Index
• U.S. municipal, investment-grade bonds: S&P Municipal Bond Index
Risk Assumptions
All investments carry some degree of risk. The volatility, or uncertainty, of future returns is a key concept of investment risk. Standard deviation is a measure of volatility and represents the variability of individual returns around the mean, or average annual, return. A higher standard deviation indicates more return volatility. This measure serves as a collective, quantitative estimate of risks present in an asset class or investment (e.g., liquidity, credit, and default risks). Certain types of risk may be underrepresented by this measure. Investors should develop a thorough understanding of the risks of any investment prior to committing funds.
Stay Informed
Subscribe
Ideas, analysis, and perspectives to help you make your next move with confidence.
What can we help you with today