Equal Housing Lender. © 2026 M&T Bank and its affiliates and subsidiaries. NMLS #381076. M&T Bank Member FDIC.
Institutional Services Insights
Wealth Management Insights
Who We Are
Log In
Select Business Area
Our Services
Institutional Services Insights
For World Cup soccer teams, halftime offers a chance to reevaluate what has been working, what has not, and what changes should be made as they retake the field for the second half. Similarly, as investors we have assessed the momentous events of the first half of 2026 - which include the Iran War, a new Federal Reserve Chair, blowout earnings growth in Q1, and a rotation in equity leadership - and see a more constructive setup that warrants an increase in portfolio risk. Economic data, earnings, and geopolitical risk have all improved, setting the stage, we believe, for the equity market to deliver solid returns over the next 12 months. The second quarter was a strong one for the market, led by remarkable returns in a few areas like memory chips. We have moved from a full allocation to equities to an overweight position versus our benchmark with the expectation of continued market momentum consistent with a stable economy and strong earnings growth.
An Improved Outlook, Yet Not Inflationary
The U.S. economy improved through the first half 2026 but remains below trend, which may end up looking like a “Goldilocks” economy to investors. We view it as strong enough to avoid recession yet not strong enough to generate inflation pressure. In the most recent two quarters (2025Q4-2026Q1) of official gross domestic product (GDP) data, inflation-adjusted growth averaged 1.3%, and the most recent tracking for 2026Q2 is 1.4%, well below our estimate of trend growth of 2%. On the positive side of the ledger, employers have been adding jobs in 2026, after the labor market dipped into negative territory in late 2025. Additionally, despite the “low-hire, low-fire” environment, the unemployment rate has remained steady due to a declining labor force. We expect job gains to continue in the second half of this year, but we don’t expect the labor market to tighten enough to generate wage pressure.
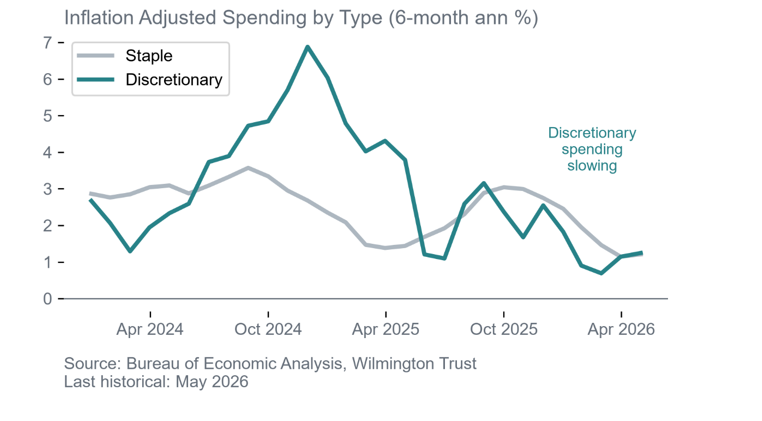
Consumer spending slowed in 2025 due to tariffs, job declines, and milder wage gains. The return to job growth and higher tax refunds in 2026 helped buoy spending, but those were counterbalanced by higher gasoline prices. Discerning consumers have reacted to higher prices at the pump by easing spending on discretionary items such as cars, restaurants, hotels, and travel, all while keeping overall spending in positive territory (Figure 1). This dynamic is the critical consideration when it comes to the inflation outlook and is far different from the experience in 2021 when prices soared. At that time job growth was surging, wage growth far exceeded inflation, consumers were sitting on piles of savings, and workers had bargaining power. In the 2026 “k-shaped” economy, each of those factors is diminished and consumers are much more constrained.
Figure 1: Slower spending growth on discretionary items
On the capital expenditure side the story is similar, with a distinct split between the buildout of Artificial Intelligence (AI) infrastructure and the more traditional economic sectors. The release of ChatGPT in late 2022 touched off a surge of construction spending on data centers, which has moved up nearly 250%. Investment in computing equipment (which includes semiconductors) has grown 150%. That has been a boon to an otherwise sluggish capex environment. Spending on all other types of commercial buildings is up just 4% over those 3 ½ years, and capex on non-computing equipment has grown just 17%. The insatiable appetite to build AI infrastructure by itself could be inflationary, but that has been counterbalanced by weaker demand in other areas.
Taken together, we see the economy as less likely to tip into recession (we estimate a 30% probability) than we did just a few months ago. But we do not see an economy that is strong enough to generate inflation and prompt the Federal Reserve (Fed) into a rate hike cycle. We see receding gasoline prices as the start of a downward move for inflation which is likely to prompt the Fed to be cutting rates later in 2026, thereby supporting valuations for equities and contributing to our decision to add to risk.
Earnings Underpin Market Strength
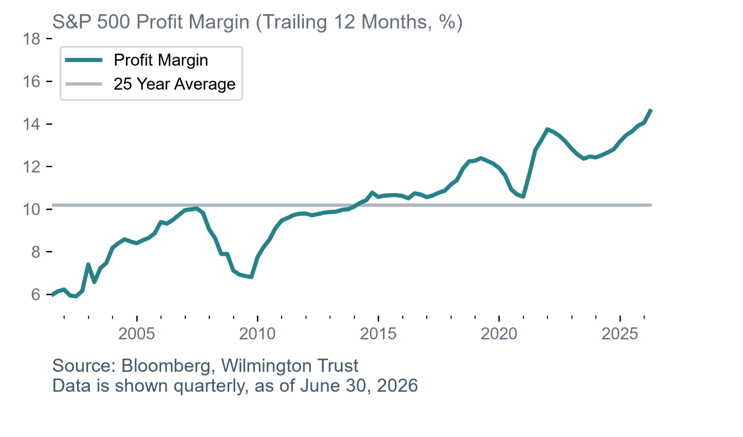
First quarter earnings for the S&P 500 were incredibly strong. Earnings were projected to grow 13.1% y/y as of March 31. At the conclusion of the first quarter reporting season (mid June), actual earnings growth was nearly 29%, the highest growth rate since the fourth quarter of 2021 when the economy was bouncing back from the pandemic. All 11 sectors delivered a positive surprise on earnings and revenue. The net profit margin for the S&P 500 hit a record high of 14.6% (going back to 2009, when Factset started tracking the data; Figure 2).
Figure 2: Profit Margins Hit New Highs
First-quarter results were given a boost by outsized earnings from a handful of tech-related companies. As an example, just five companies[1] were responsible for more than 32% of first quarter earnings growth on a y/y basis. The Magnificent 7 delivered earnings growth of 63.2%, while the rest of the market delivered growth of 17.4%, a rate that in any other market would be seen as more than respectable.
Earnings estimates continue to be revised higher, and we expect that earnings growth across sectors will continue to act as a tailwind for the market over the coming year.
Geopolitical Risks Recede
The U.S.-Iran War took geopolitical risk to a boil in the first half of the year. Markets reacted favorably after the April 8 ceasefire was announced, but the situation remained tenuous. Consumers used tax refunds to help offset higher oil prices, and global storage for oil was depleted as the Strait of Hormuz remained closed. At the time, we assessed that the economic risks of the Strait remaining closed through the summer would build, dramatically increasing recession risks as we moved through the year. In other words, “left tail risk” (i.e., the probability of a very negative market event occurring that would incur steep losses on a portfolio) was too high, especially considering our clients were already fully invested.
The June 17 Memorandum of Understanding (MOU) between the U.S. and Iran indicated to us that the greatest economic risks associated with higher oil prices are largely behind us. Geopolitical tensions in the Middle East may continue, and there could very well be a “geopolitical risk premium” embedded in the price of oil for some time, but the MOU has removed a key overhang and allows us to focus on economic and market fundamentals.
Opportunities Across Equity Asset Classes
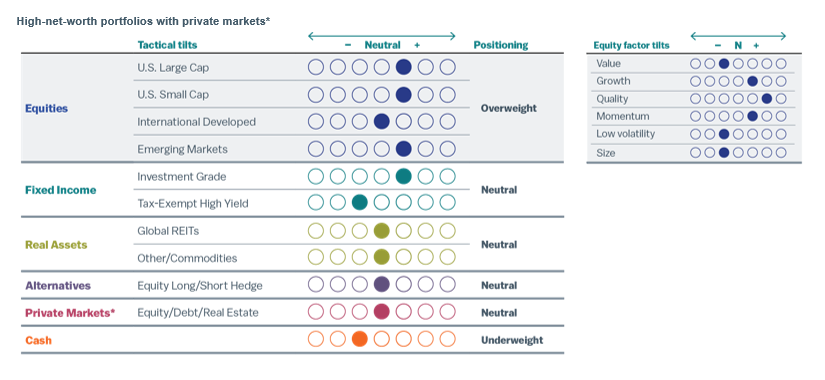
We shifted capital from defensive assets, namely investment-grade fixed income and cash, to U.S. large cap, U.S. small cap, and emerging market equities. We see opportunities for these asset classes to outperform and continue to think a diversified approach is best.
The economy is expected to run below trend, but this could prove to be “just right” by investors’ standards, particularly if it allows the Fed to cut rates in an expansionary economy. Our expectation for interest rate cuts from the Fed in 2026 should support valuations for U.S. equities, especially small cap, which tends to be more sensitive to changes in interest rates given higher leverage for the index. We would also expect lower rates from the Fed to put downward pressure on the U.S. dollar, and historically emerging market equities have exhibited a negative correlation with the U.S. dollar (since many emerging market economies borrow in U.S. dollars, so a weaker dollar reduces their debt servicing costs).
It is unclear how Artificial-Intelligence-focused names will fare in the short term. U.S. large cap and emerging market equities are highly exposed to the memory chips and broader semiconductor names that have led the market. Demand continues to exceed supply in the short term, and we expect that to be reinforced in the upcoming earnings season. However, we are eyeing valuations and earnings projections to carefully to pick our spots within the tech complex.
Importantly, if the Fed does not end up cutting rates as we expect, it would be because growth is stronger than forecasted and the economy does not need rate cuts, not because inflation is re-accelerating. In that situation they would hold rates steady (we place the lowest probability on the Fed raising rates). This would be a good backdrop for equities, which typically perform well in the face of moderate inflation given their ability to pass through input costs.
The equity market is not cheap, but strong earnings have outpaced price returns, helping valuations move lower for U.S. large cap and emerging market equities since the start of the year. Valuations for small cap have increased, but on a long-term basis they still look reasonable, especially relative to large cap given years of underperformance.
Core Narrative
The equity market delivered a strong quarter with new all-time highs, but we think there is more to come. Recession risks have receded and earnings are robust. Certain parts of the market that have been on a tear, like within tech, could take a breather, but we still think we are only middle innings of the AI infrastructure buildout. In addition, we expect investors to rotate into other parts of the market rather than withdraw from risk assets. Midterm elections could introduce volatility, but polling data suggests gridlock is the most likely outcome, which is generally a favorable outcome for equities. The biggest risk could come from the Fed hiking rates, but this is already priced into the Fed funds futures market, so it would not be a complete surprise to markets. For long-term investors, now may be a good time to lean into risk and stay diversified (Figure 3).
Figure 3: Overweight to Risk in Portfolios
High-Net-Worth Portfolios With Private Markets
Data as of June 30, 2026. Positioning reflects our monthly tactical asset allocation (TAA) versus the long-term strategic asset allocation (SAA) benchmark. For an overview of our asset allocation strategies, please see the disclosures.
*Private markets are only available to investors that meet Securities and Exchange Commission standards and are qualified and accredited. We recommend a strategic allocation to private markets we do not tactically adjust this asset class.
[1] Micron Technology, Meta Platforms, Alphabet, Amazon, and NVIDIA, according to Factset, as of May 21, 2026.
Definitions
A K-shaped economy is one in which economic growth is unevenly distributed, with some industries, consumers, or businesses experiencing strong growth while others face stagnation or decline.
Magnificent 7 represented by the following: Nvidia, Apple, Microsoft, Alphabet, Amazon, Meta, Tesla.
Disclosures
Facts and views presented in this report have not been reviewed by, and may not reflect information known to, professionals in other business areas of Wilmington Trust or M&T Bank who may provide or seek to provide financial services to entities referred to in this report. M&T Bank and Wilmington Trust have established information barriers between their various business groups. As a result, M&T Bank and Wilmington Trust do not disclose certain client relationships with, or compensation received from, such entities in their reports.
The information on Wilmington Wire has been obtained from sources believed to be reliable, but its accuracy and completeness are not guaranteed. The opinions, estimates, and projections constitute the judgment of Wilmington Trust and are subject to change without notice. This commentary is for informational purposes only and is not intended as an offer or solicitation for the sale of any financial product or service or a recommendation or determination that any investment strategy is suitable for a specific investor. Investors should seek financial advice regarding the suitability of any investment strategy based on the investor’s objectives, financial situation, and particular needs. Diversification does not ensure a profit or guarantee against a loss. There is no assurance that any investment strategy will succeed.
Past performance cannot guarantee future results. Investing involves risk and you may incur a profit or a loss.
Indexes are not available for direct investment. Investment in a security or strategy designed to replicate the performance of an index will incur expenses such as management fees and transaction costs which will reduce returns.
References to specific securities are not intended and should not be relied upon as the basis for anyone to buy, sell, or hold any security. Holdings and sector allocations may not be representative of the portfolio manager’s current or future investment and are subject to change at any time.
Reference to the company names mentioned in this blog is merely for explaining the market view and should not be construed as investment advice or investment recommendations of those companies. Third party trademarks and brands are the property of their respective owners.
Any investment products discussed in this commentary are not insured by the FDIC or any other governmental agency, are not deposits of or other obligations of or guaranteed by M&T Bank, Wilmington Trust, or any other bank or entity, and are subject to risks, including a possible loss of the principal amount invested.
Some investment products may be available only to certain “qualified investors”—that is, investors who meet certain income and/or investable assets thresholds.
Alternative assets, such as strategies that invest in hedge funds, can present greater risk and are not suitable for all investors.
An Overview of Our Asset Allocation Strategies
Wilmington Trust offers seven asset allocation models for taxable (high-net-worth) and tax-exempt (institutional) investors across five strategies reflecting a range of investment objectives and risk tolerances: Aggressive, Growth, Growth & Income, Income & Growth, and Conservative. The seven models are High Net Worth (HNW), HNW with Liquid Alternatives, HNW with Private Markets, HNW Tax Advantaged, Institutional, Institutional with Hedge LP, and Institutional with Private Markets. As the names imply, the strategies vary with the type and degree of exposure to hedge strategies and private market exposure, as well as with the focus on taxable or tax-exempt income. On a quarterly basis we publish the results of all of these strategy models versus benchmarks representing strategic implementation without tactical tilts.
Model Strategies may include exposure to the following asset classes: U.S. large-capitalization stocks, U.S. small-cap stocks, developed international stocks, emerging market stocks, U.S. and international real asset securities (including inflation-linked bonds and commodity-related and real estate-related securities), U.S. and international investment-grade bonds (corporate for Institutional or Tax Advantaged, municipal for other HNW), U.S. and international speculative grade (high-yield) corporate bonds and floating-rate notes, emerging markets debt, and cash equivalents. Model Strategies employing nontraditional hedge and private market investments will, naturally, carry those exposures as well. Each asset class carries a distinct set of risks, which should be reviewed and understood prior to investing.
ALLOCATIONS:
Each strategy group is constructed with target policy weights for each asset class. Wilmington Trust periodically adjusts the policy weights target allocations and may shift away from the target allocations within certain ranges. Such tactical adjustments to allocations typically are considered on a monthly basis in response to market conditions. The asset classes and their current proxies are:
• Large–cap U.S. stocks: Russell 1000® Index
• Small–cap U.S. stocks: Russell 2000® Index
• Developed international stocks: MSCI EAFE® (Net) Index
• Emerging market stocks: MSCI Emerging Markets Index
• U.S. inflation-linked bonds: Bloomberg US Treasury Inflation Notes TR Index Value Unhedged USD (took effect 8/1/22)
• International inflation-linked bonds: Bloomberg World ex US ILB (Hedged) Index
• Commodity-related securities: Bloomberg Commodity Index
• U.S. REITs: S&P US REIT Index
• International REITs: Dow Jones Global ex US Select RESI Index
• Private markets: S&P Listed Private Equity Index
• Hedge funds: HFRX Global Hedge Fund Index (took effect 8/1/22)
• U.S. taxable, investment-grade bonds: Bloomberg U.S. Aggregate Index
• U.S. high-yield corporate bonds: Bloomberg U.S. Corporate High Yield Index
• U.S. municipal, investment-grade bonds: S&P Municipal Bond Index
Risk Assumptions
All investments carry some degree of risk. The volatility, or uncertainty, of future returns is a key concept of investment risk. Standard deviation is a measure of volatility and represents the variability of individual returns around the mean, or average annual, return. A higher standard deviation indicates more return volatility. This measure serves as a collective, quantitative estimate of risks present in an asset class or investment (e.g., liquidity, credit, and default risks). Certain types of risk may be underrepresented by this measure. Investors should develop a thorough understanding of the risks of any investment prior to committing funds.
Stay Informed
Subscribe
Ideas, analysis, and perspectives to help you make your next move with confidence.
What can we help you with today