Data from 9/30/2001 through 12/31/2023.
Sources: eVestment, MSCI Barra, Bloomberg, Morningstar.
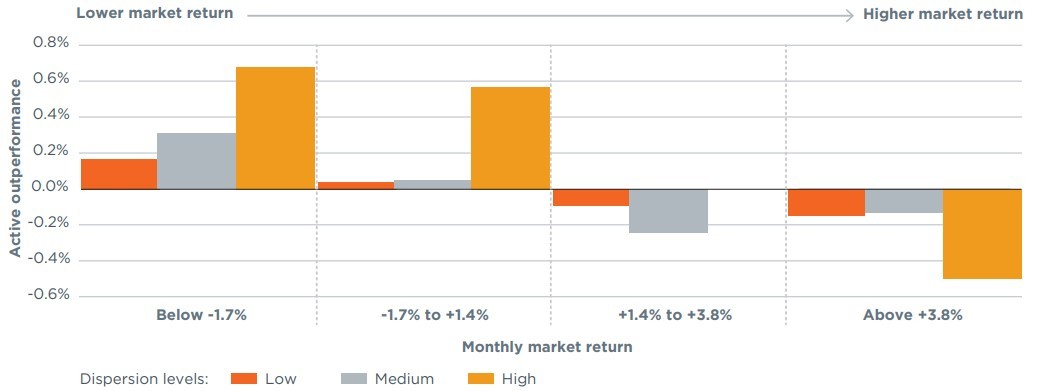
Figure 6 shows the median U.S. Large Cap Core active strategy out/underperformance (net of fees) versus the Russell 1000 using the eVestment universe. Active outperformance is segmented by quartile of market return and levels of market dispersion. Clusters of bars correspond to ranges of market return and the individual bars within clusters correspond to levels of market dispersion. The Russell 1000 index is used for market return and buckets are calculated on the entire time series. Market dispersion is defined as the cross-sectional standard deviation of iShares Russell 1000 ETF (IWB) holdings and it is bucketed into low (0-25th percentile), medium (25th-75th percentile) and high (75th to 100th percentile) segments, based on an expanding window. Returns are monthly.
We do filter the eVestment universe because there are some passive strategies and some low volatility/low beta strategies. We do our best to remove those because we want active (not passive) strategies and because low vol is more of a smart beta strategy. Excluding low vol also is a conservative approach in the sense that low vol/low beta strategies would exhibit an outperformance in down markets.
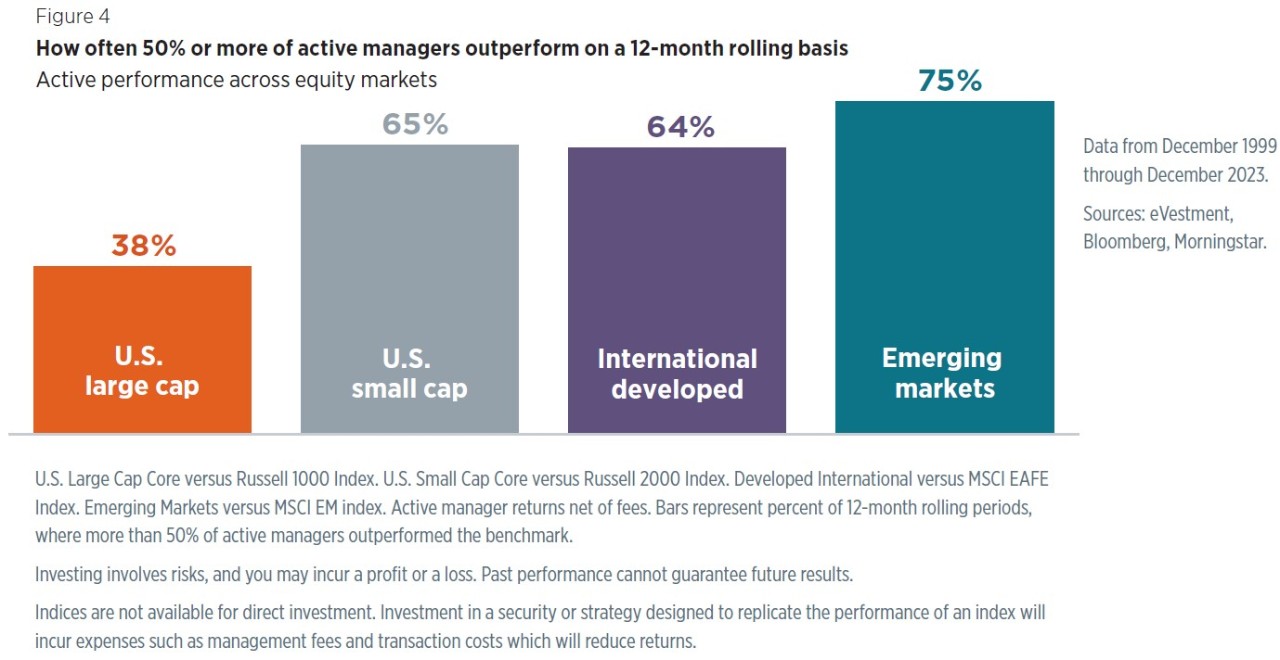
Investing involves risks, and you may incur a profit or a loss. Past performance cannot guarantee future results.
Indices are not available for direct investment. Investment in a security or strategy designed to replicate the performance of an index will incur expenses such as management fees and transaction costs which will reduce returns.
However, in the quartile with the strongest market returns, high dispersion is consistent with lower active performance. Why is this? One challenging scenario for active management is a bull market where index returns are driven by a handful of stocks. As an example, consider the first half of 2023: The S&P 500 was up almost 17% through June 30, 2023. However, this strong performance was due almost entirely to the “Magnificent 7” stocks (Apple, Microsoft, Google parent, Alphabet, Amazon, Nvidia, Meta Platforms, and Tesla), which were up over 86%. The average stock in the index, meanwhile, was up a more modest 5.6%.6
We would characterize the first half of 2023 as a low breadth or narrow market, meaning that a large number of firms did not participate in market returns. We’d also characterize the period as one of high concentration, in that index weights were clustered in a small number of names. In low breadth and high concentration environments like this one, dispersion is high, due to the massive outlier returns of a small group of stocks. This set of characteristics limits the opportunity for stock picking and thus active outperformance. Furthermore, active strategies often have an explicit cap on the weight their portfolio can have in each name (typically used as a means of managing risk), making it challenging to outperform when market breadth is low and market concentration is high.7 In 2023, we saw active large-cap strategies struggle in the first six months of the year. However, during the third quarter, the equity market corrected lower and actively managed strategies in our portfolios proved their worth. This performance continued into the end of the year and meant that portfolios—in no small part because of allocations to active strategies—outperformed their benchmarks over what was a very difficult year.
Putting it all together
At Wilmington Trust, we believe that an optimal approach combines both passive and active strategies. Active management brings a unique contribution to portfolios, but allocating capital to active brings additional risk and expenses, necessitating expertise and thoughtful consideration on the part of investors. In-depth manager research and ongoing due diligence are critical to selecting the managers likely to perform best on a risk-adjusted basis going forward. The dynamics across asset classes and market environments can help identify when and where active management is most likely to add value to a portfolio. We aim to understand when a manager may outperform its benchmark and/or peers and when it may underperform, evaluating how well a manager has executed its strategy relative to expectations.
Our portfolio construction process incorporates both active and passive strategies, seeking to capitalize on the benefits of each approach and, for taxable investors, keeping tax efficiency top of mind. Our manager research team and due diligence process maintain a strong platform of active, passive, and smart beta strategies. Our beta, or market exposure, comes from active, smart beta, and passive strategies. Factor exposure is obtained via a combination of smart beta and active managers. When allocating to active managers, the hope is that they can provide alpha in portfolios beyond their market and factor exposures to justify their cost. For clients with sufficient assets to meet required strategy minimums, we often prioritize SMAs. Since SMAs hold individual names directly, they can be more tax efficient. SMAs also generally carry a lower fee than mutual fund equivalents.
Overall, we believe active management should play a larger role in less efficient asset classes, such as U.S. small cap, international equities, and fixed income, and be employed more selectively in more efficient asset classes, such as U.S. large cap. While we do not programmatically adjust the mix of active and passive based on expected changes in market volatility, breadth, and dispersion, we do use these factors to explain performance and may make strategic adjustments over time. The reality that it is difficult to predict market conditions cannot be emphasized enough.
However, in some scenarios, it can be sensible to adjust portfolios according to expectations for the future market environment. For instance, a strong equity market relative to history may be followed by elevated volatility, so a further tilt toward active management may be beneficial. This approach to manager selection added value in 2023 despite narrow market leadership, creating a difficult environment for U.S. large-cap active strategies. We will continue to elevate and evolve our investment process as industry and market conditions warrant.
 Equal Housing Lender. © 2026 M&T Bank and its affiliates and subsidiaries. NMLS #381076. M&T Bank Member FDIC.