© 2024 M&T Bank and its affiliates and subsidiaries. All rights reserved.
Wilmington Trust is a registered service mark used in connection with various fiduciary and non-fiduciary services offered by certain subsidiaries of M&T Bank Corporation including, but not limited to, Manufacturers & Traders Trust Company (M&T Bank), Wilmington Trust Company (WTC) operating in Delaware only, Wilmington Trust, N.A. (WTNA), Wilmington Trust Investment Advisors, Inc. (WTIA), Wilmington Funds Management Corporation (WFMC), Wilmington Trust Asset Management, LLC (WTAM), and Wilmington Trust Investment Management, LLC (WTIM). Such services include trustee, custodial, agency, investment management, and other services. International corporate and institutional services are offered through M&T Bank Corporation’s international subsidiaries. Loans, credit cards, retail and business deposits, and other business and personal banking services and products are offered by M&T Bank. Member, FDIC. 
M&T Bank Corporation’s European subsidiaries (Wilmington Trust (UK) Limited, Wilmington Trust (London) Limited, Wilmington Trust SP Services (London) Limited, Wilmington Trust SP Services (Dublin) Limited, Wilmington Trust SP Services (Frankfurt) GmbH and Wilmington Trust SAS) provide international corporate and institutional services.
WTIA, WFMC, WTAM, and WTIM are investment advisors registered with the U.S. Securities and Exchange Commission (SEC). Registration with the SEC does not imply any level of skill or training. Additional Information about WTIA, WFMC, WTAM, and WTIM is also available on the SEC's website at adviserinfo.sec.gov. 
Private Banking is the marketing name for an offering of M&T Bank deposit and loan products and services.
M&T Bank  Equal Housing Lender. Bank NMLS #381076. Member FDIC. 
Investment and Insurance Products   • Are NOT Deposits  • Are NOT FDIC Insured  • Are NOT Insured By Any Federal Government Agency  • Have NO Bank Guarantee  • May Go Down In Value  
Investing involves risks and you may incur a profit or a loss. Past performance cannot guarantee future results. This material is provided for informational purposes only and is not intended as an offer or solicitation for the sale of any security or service. It is not designed or intended to provide financial, tax, legal, accounting, or other professional advice since such advice always requires consideration of individual circumstances. There is no assurance that any investment, financial or estate planning strategy will be successful.

As the 2024 presidential election quickly approaches, changes in U.S. policy could bring new risks and opportunities for the economy and markets. At Wilmington Trust, our objective is to provide timely updates on the election to help clients make sense of the headlines and potential implications for their portfolios. While the platforms of both candidates have largely been communicated to voters, there is no guarantee new proposals will be enacted into law, increasing uncertainty. With less than a month to go until the election, investors have become more focused on the potential risks to their portfolios. Here, we aim to address some of the most common and pressing questions on the minds of our clients.

What are the potential implications of the election on debt and deficits?

  • The next administration will face fiscal challenges, regardless of who controls the White House and Congress. According to the Congressional Budget Office (CBO), the federal deficit for fiscal year 2025 (which began October 1) is forecast at $1.94 trillion, or 6.5% of gross domestic product (GDP). This is the CBO’s baseline projection based on legislation enacted through May. The 10-year cumulative deficit is projected to be $22.1 trillion and average 6.3% of GDP. Higher interest rates and rising debt levels pose risks to economic growth and fiscal sustainability.[1]
  • Both presidential candidates are pursuing economic agendas that would likely increase the deficit. According to the nonpartisan think tank the Committee for a Responsible Federal Budget (CRFB), Harris's platform would add $3.50 trillion to the national debt through Fiscal Year (FY) 2035, while Trump would increase it by $7.5 trillion. As a percentage of GDP, the debt will grow to 133% under Harris and 142% under Trump. These figures are highly uncertain as the makeup of Congress will determine the ability of either candidate to push through their agendas.[2]
  • Harris’s costliest proposal is an expansion of the child tax credit from $2,000 up to $3,600 per year per child. She also wants a $6,000-per-year credit for newborns. Other major items include expanding the earned income tax credit for lower income workers, providing a $25,000 tax credit for first-time homebuyers, and boosting Affordable Care Act subsidies. To help offset these additional costs, Harris would raise taxes on corporations and high-income earners, while maintaining tax cuts for individuals making under $400,000.[3]
  • Trump’s plan includes extending all the 2017 tax cuts from the Tax Cuts and Jobs Act ($4 trillion alone), plus additional tax breaks for the wealthy and businesses. His proposal to end taxes on Social Security  would reduce federal revenue by up to $1.8 trillion through 2033.[4] To raise revenue, Trump has proposed new tariffs on imports and repealing clean energy-related spending and tax cuts. While his tariffs could in theory raise several trillion dollars over the next decade, most studies don’t take into account potential retaliatory actions and other economic impacts.[5]

How would each candidate’s proposed policies affect our view of inflation?

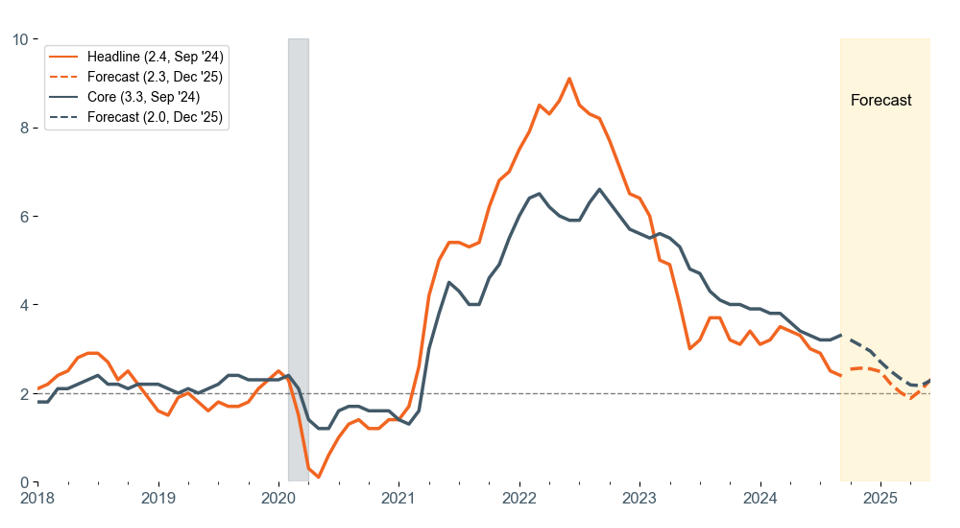
  • After reaching a high of 9.1% in June 2022, inflation as measured by the Consumer Price Index (CPI), has fallen to 2.4% as of September 2024 ( Figure 1). We expect inflation to reach the Fed’s target of 2.0% in the first quarter of 2025. The economic agendas of both candidates would likely increase U.S. deficits and debts, leading to higher long-term inflation, in our view.

Figure 1

Headline CPI continues to make great progress, ticking down to 2.4% in year-over-year terms

Consumer Price Index (CPI) inflation and forecast (y/y% change)
Source: Bureau of Labor Statistics, Wilmington Trust. Data as of October 10, 2024.

  • Trump has said he’ll use his executive authority to apply a 10%–20% tariff on most imports as well as a 60% tariff on Chinese goods. Higher tariffs would have a negative effect on sectors like consumer discretionary and staples which import goods for domestic consumption. Trump’s tariffs, if implemented, would increase costs for businesses, resulting in higher prices and a potential pullback in consumer spending. This raises the risk of a recession, and ultimately could lead to lower inflation.
  • Harris’s proposed subsidies for first-time homebuyers may boost home prices in the near term due to greater demand for houses without a commensurate increase in supply. Her planned expansion of the child tax credit could also lead to more general price pressures and higher inflation.
  • Trump has also said he will institute stricter immigration policies. While his plan includes restricting unauthorized migrants at the southern border, he would try to open up more channels for legal immigration. This could limit the supply of low-skilled workers, causing wage inflation to rise. Immigration has been critical to easing post-pandemic U.S. worker shortages, particularly in industries like agriculture, construction, and retail, as well as leisure and hospitality.[6]
  • Immigration has also helped to sustain consumer spending in the face of heightened economic uncertainty. Long term, immigration will be necessary to support the economy and labor force growth in the face of a rapidly aging population. However, the recent surge in migrant inflows has highlighted the need for policy reforms to ensure that the economy continues to benefit from immigration.

Could a new administration affect prescription drug prices?

  • The high cost of prescription drugs in America has been hotly contested in Congress for years. Americans spend more than $1,500 per person every year on prescription drugs. Prices tend to be far greater than in other countries due to a lack of market competition.[7]
  • In this election cycle, we expect less policy uncertainty around the issue, primarily due to recently enacted legislation. In 2022, the Inflation Reduction Act (IRA) was passed into law by President Biden. The bill aimed to increase competition in the pharmaceutical industry and lower the price of prescription drugs for people with Medicare. It allows the government to negotiate prices for prescription drugs and limits what Medicare recipients pay out of pocket for drugs to $2,000 per year.[8] While the IRA will likely reduce the return on research and development costs for pharmaceutical companies, the impact is likely to be greatest for drugs targeting rare and complex diseases.
  • If elected, both presidential candidates have said they’ll pursue some form of drug price reform. Harris has proposed extending the limit on out-of-pocket expenses to all Americans, not just Medicare recipients. She would also speed up Medicare negotiations on the price of prescription drugs and limit anti-competitive practices in the pharmaceutical industry that drive up prices.[9]
  • While Trump may try to repeal or minimize some elements of the IRA, we think it’s more likely he’ll look to adopt other forms of price reform. In his previous term, he proposed a number of new policies, such as increasing the importation of cheaper drugs from abroad and reducing the cost of insulin for low-income patients.[10]

How are bonds expected to perform in the next few years?

  • After two years of aggressive central bank actions intended to dampen inflation, the Federal Reserve (Fed) is finally easing policy. All else equal, the Fed cutting rates should support total returns of investment-grade fixed income. Rates are still elevated versus the post-global financial crisis era, and our expectation for 200 basis points, or bps (2.00%), of rate cuts over the next 15 months supports a steepening of the yield curve. Credit fundamentals are also healthy across taxable and municipal bonds. However, we do not see long-duration yields declining. In fact, our expectation is for a slight increase in the 10-year Treasury yield over the next 12 months to 4.25%.
  • Wilmington Trust currently holds a neutral allocation to investment-grade bonds relative to our strategic asset allocation benchmark. In a period of easing monetary policy and solid earnings growth, we expect equities to outperform fixed income over our 9–12-month tactical time horizon. Longer term, trend-like economic growth and elevated deficits could keep rates higher, allowing bonds to continue to generate income but limiting price appreciation. We believe that active management, particularly in the relatively inefficient asset class of municipal bonds, is a sound strategy to capitalize on mis-pricings in the market across sectors and issuers.

How do you suggest investing with the market at all-time highs? Should we be sitting on extra cash?

  • In 2025, we expect the U.S. economy to continue to expand with economic growth of 1.3% as inflation decelerates, consumer and business spending moderate, and the Fed eases policy. Given our constructive view on the economy, we hold an overweight to equities versus our strategic asset allocation and recommend that investors holding excess cash deploy that strategically over the coming months. Typically, we advise investing excess cash over a period of six months, though this strategy is dependent on individual cash needs and risk tolerance.
  • We favor U.S. equities over international and are diversifying across sectors. Small cap is expected to benefit from the easing of monetary policy, as smaller companies hold roughly four times the amount of interest-rate-sensitive debt as larger companies. Valuations are also relatively more attractive in U.S. small cap. International developed economies are showing muted growth. We currently hold an underweight to international equities (neutral to emerging markets).

Figure 2

Asset Allocation

High-net-worth portfolios with private markets*
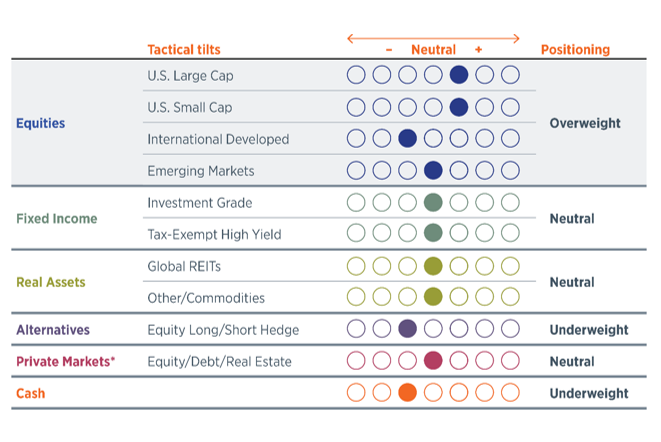
Data as of September 30, 2024. Positioning reflects our monthly tactical asset allocation (TAA) versus the long-term strategic asset allocation (SAA) benchmark. For an overview of our asset allocation strategies, please see the disclosures.

*Private markets are only available to investors that meet Securities and Exchange Commission standards and are qualified and accredited. We recommend a strategic allocation to private markets we do not tactically adjust this asset class.

  • Within equities, we are balancing the growth and value factors and focusing on high-quality companies. We expect the recent broadening of market leadership to continue, which should support cyclical areas of the market and active management (active managers have tended to be underweight the largest tech stocks versus their benchmarks).
  • Despite elevated equity valuations, we see further upside for the equity market but expect more muted returns than we saw over the last 12 months. Diversification can be critical in a portfolio, particularly with valuations elevated across asset classes. As we approach Election Day, we may see a pickup in equity volatility. This may create opportunities to deploy excess cash in a weaker market.

Core narrative

The presidential election has shaped up to be a tight race, keeping policy uncertainty high. As policy paths narrow and we gain more clarity around the election outcome, we will continue to provide timely updates on potential economic and market implications. At this point, it is too soon to make firm conclusions. While changes to policy have the potential to affect the U.S. economy and markets, it’s just one of the many factors we consider when positioning portfolios. Macro dynamics, such as the Fed’s pivot to rate cuts, may play a larger role in how asset classes trade broadly and at the sector level over the medium to long term. Further, there is no guarantee that candidate platforms will be fully adopted or have the intended effect on the U.S. economy. We will continue to monitor election-related risks and opportunities as they evolve and provide regular updates on our current thinking as it relates to the markets and portfolio positioning.

[1] Michael Rainey, “CBO Raises Its 2024 Deficit Forecast 27% to Nearly $2 Trillion (yahoo.com),” Yahoo, June 20, 2024,

[2] “The Fiscal Impact of the Harris and Trump Campaign Plans-Mon, 10/07/2024 - 12:00 | Committee for a Responsible Federal Budget (crfb.org),” Committee for a Responsible Federal Budget (CRFB), October 7, 2024.

[3] Nik Popli, “Kamala Harris Rolls Out Economic Plan. Here's What's In It | TIME,” TIME, August 16, 2024.

[4]  “Donald Trump's Suggestion to End Taxation of Social Security Benefits-2024-07-31 (crfb.org),” CRFB, July 31, 2024.

[5] Brett Rowland, “Trump's plan to offset tax cuts extension is 'highly uncertain' | National | thecentersquare.com,” The Center Square, October 3, 2024.

[6] Mark Zandi, et al, “assessing-the-macroeconomic-consequences-of-harris-vs-trump.pdf (moodys.com),” Moody’s, August 2024.

[7] Melissa Pistilli, “Harris vs. Trump: The 2024 US Election, Drug Prices and Healthcare (msn.com),” MSN, October 2024.

[8] Bruce Gil, “Kamala Harris' plan to keep prescription drug prices down includes a $2,000 cap on out-of-pocket costs (msn.com),” August 2024.

[9] “Kamala Harris' plan to keep prescription drug prices down includes a $2,000 cap on out-of-pocket costs (msn.com)

[10] “Harris vs. Trump: The 2024 US Election, Drug Prices and Healthcare (msn.com)

Disclosures

Facts and views presented in this report have not been reviewed by, and may not reflect information known to, professionals in other business areas of Wilmington Trust or M&T Bank who may provide or seek to provide financial services to entities referred to in this report. M&T Bank and Wilmington Trust have established information barriers between their various business groups. As a result, M&T Bank and Wilmington Trust do not disclose certain client relationships with, or compensation received from, such entities in their reports.

The information on Wilmington Wire has been obtained from sources believed to be reliable, but its accuracy and completeness are not guaranteed. The opinions, estimates, and projections constitute the judgment of Wilmington Trust and are subject to change without notice. This commentary is for informational purposes only and is not intended as an offer or solicitation for the sale of any financial product or service or a recommendation or determination that any investment strategy is suitable for a specific investor. Investors should seek financial advice regarding the suitability of any investment strategy based on the investor’s objectives, financial situation, and particular needs. Diversification does not ensure a profit or guarantee against a loss. There is no assurance that any investment strategy will succeed.

Past performance cannot guarantee future results. Investing involves risk and you may incur a profit or a loss.

Indexes are not available for direct investment. Investment in a security or strategy designed to replicate the performance of an index will incur expenses such as management fees and transaction costs which will reduce returns.

CFA® Institute marks are trademarks owned by the Chartered Financial Analyst® Institute.

Any investment products discussed in this commentary are not insured by the FDIC or any other governmental agency, are not deposits of or other obligations of or guaranteed by M&T Bank, Wilmington Trust, or any other bank or entity, and are subject to risks, including a possible loss of the principal amount invested.

Some investment products may be available only to certain “qualified investors”—that is, investors who meet certain income and/or investable assets thresholds.

Alternative assets, such as strategies that invest in hedge funds, can present greater risk and are not suitable for all investors.

An Overview of Our Asset Allocation Strategies

Wilmington Trust offers seven asset allocation models for taxable (high-net-worth) and tax-exempt (institutional) investors across five strategies reflecting a range of investment objectives and risk tolerances: Aggressive, Growth, Growth & Income, Income & Growth, and Conservative. The seven models are High Net Worth (HNW), HNW with Liquid Alternatives, HNW with Private Markets, HNW Tax Advantaged, Institutional, Institutional with Hedge LP, and Institutional with Private Markets. As the names imply, the strategies vary with the type and degree of exposure to hedge strategies and private market exposure, as well as with the focus on taxable or tax-exempt income. On a quarterly basis we publish the results of all of these strategy models versus benchmarks representing strategic implementation without tactical tilts.

Model Strategies may include exposure to the following asset classes: U.S. large-capitalization stocks, U.S. small-cap stocks, developed international stocks, emerging market stocks, U.S. and international real asset securities (including inflation-linked bonds and commodity-related and real estate-related securities), U.S. and international investment-grade bonds (corporate for Institutional or Tax Advantaged, municipal for other HNW), U.S. and international speculative grade (high-yield) corporate bonds and floating-rate notes, emerging markets debt, and cash equivalents. Model Strategies employing nontraditional hedge and private market investments will, naturally, carry those exposures as well. Each asset class carries a distinct set of risks, which should be reviewed and understood prior to investing.

ALLOCATIONS:

Each strategy group is constructed with target policy weights for each asset class. Wilmington Trust periodically adjusts the policy weights target allocations and may shift away from the target allocations within certain ranges. Such tactical adjustments to allocations typically are considered on a monthly basis in response to market conditions. The asset classes and their current proxies are:

•       Large–cap U.S. stocks: Russell 1000® Index

•       Small–cap U.S. stocks: Russell 2000® Index

•       Developed international stocks: MSCI EAFE® (Net) Index

•       Emerging market stocks: MSCI Emerging Markets Index

•       U.S. inflation-linked bonds: Bloomberg US Treasury Inflation Notes TR Index Value Unhedged USD (took effect 8/1/22)

•       International inflation-linked bonds: Bloomberg World ex US ILB (Hedged) Index

•       Commodity-related securities: Bloomberg Commodity Index

•       U.S. REITs: S&P US REIT Index

•       International REITs: Dow Jones Global ex US Select RESI Index

•       Private markets: S&P Listed Private Equity Index

•       Hedge funds: HFRX Global Hedge Fund Index (took effect 8/1/22)

•       U.S. taxable, investment-grade bonds: Bloomberg U.S. Aggregate Index

•       U.S. high-yield corporate bonds: Bloomberg U.S. Corporate High Yield Index

•       U.S. municipal, investment-grade bonds: S&P Municipal Bond Index

Stay Informed

Subscribe

Sign up here to receive insights designed to help you succeed.

Sign Up Now

WTU Newsletter Card
WTU Newsletter Handler