 Equal Housing Lender. © 2026 M&T Bank. NMLS #381076. Member FDIC. All rights reserved.
 Equal Housing Lender. © 2026 M&T Bank. NMLS #381076. Member FDIC. All rights reserved.
December 2, 2022—Inflation remains high, and the Federal Reserve (Fed) remains aggressive, raising the risk of a recession in the U.S. As we recently wrote, in reassessing the risk of a U.S. recession in 2023, we now see a 55% probability for a downturn and 40% for a “soft landing.” The critical swing factor is the speed at which inflation decelerates and, by extension, the ultimate peak of rate hikes from the Federal Reserve. We are encouraged by the October Consumer Price Index (CPI) inflation report that showed a slowing in price pressure, but inflation is still running high. It increasingly looks as though the Fed will need to follow through on its stated willingness to cause a recession in order to bring inflation down. This is all reflected by an inverted yield curve, a well-known harbinger of recession. Additionally, crude oil prices are another historical trigger of downturns and remain at levels that challenge economic growth, despite coming down since peaking mid-year. Although we now expect economic contraction, we are not bearish on equity returns and maintain a neutral allocation to the asset class.
What’s the scenario?
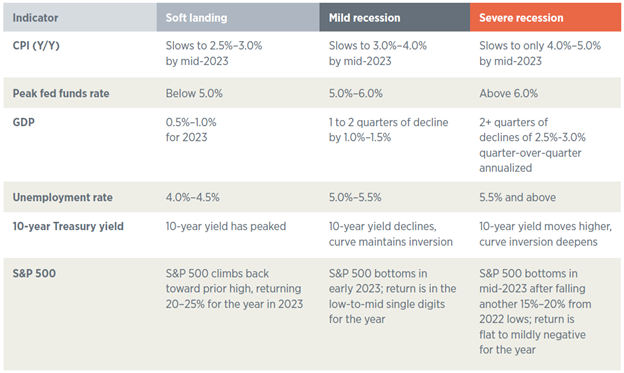
We outline three scenarios for the U.S. economy (Figure 1). In a soft landing, inflation slows quickly enough for the Fed to cease hiking rates in early 2023 and keep the peak below 5%. Gross domestic product (GDP) growth remains mildly positive, and the unemployment rate drifts up a bit. But in our view, it is now more likely that inflation will slow quickly enough, and the Fed will hike rates to between 5% and 6%, pushing harder on the brake pedal leading to economic contraction. We currently put a 55% probability on the mild recession scenario and 40% on a soft landing. The remaining 5% is reserved for a severe recession in which inflation remains between 4% and 5% even into mid-2023, bringing on a much more aggressive monetary policy.
Figure 1: Outlook under three possible scenarios

It’s all about the curve
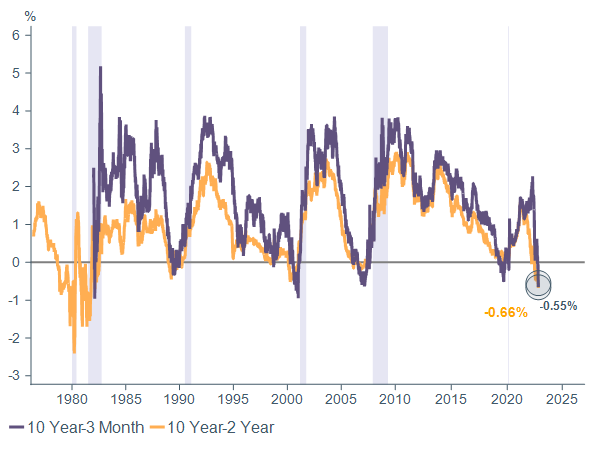
The Treasury yield curve is a powerful tool both for gauging the current state of the economy and for prediction. Figure 2 below shows two different slopes of the curve and how they have evolved over time. One is the “10-2 spread,” which is the simple subtraction of the 2-year yield from the 10-year yield. The second is similar but subtracts the 3-month yield from the 10-year. Longer-term interest rates should generally be higher than short-term rates because of the inherent uncertainty and risk in holding long-maturity securities. This is known as the “term premium.”
But sometimes the curve inverts, as can be seen below (when the lines move below zero). This occurs, generally, when the Fed has elevated short-term rates but the market is pushing the 10-year yield down. This can happen for several reasons, including any or all of the following:
Today’s environment is likely reflecting 1 and 2, in our view. The Fed has stated plainly it is willing to induce a recession in order to get inflation under control. The mantra has been consistent throughout this year, and markets are reflecting the Fed’s resoluteness on this topic.
Importantly, yield curve inversions have historically been reliable predictors of recessions. Since 1970, on average, the U.S. economy has entered a recession 20 months after an inversion of the 10 year-2 year slope, and 15 months after inversion of the 10 year-3 month portion of the curve. This year, the 10-2 spread went negative in July 2022, while the 10 year-3 month inverted more recently, dipping into negative territory briefly in late October and early November, then moving decidedly negative starting November 8.
Figure 2: Inverted yield curve
10-year Treasury yield minus shorter-term Treasury yields (%)

Sources: Bloomberg, Macrobond, WTIA. Data through November 16, 2022.
Past performance cannot guarantee future results.
Oil contributes to recession probability
Relatively high oil prices are contributing to the probability of recession. A barrel of West Texas Intermediate started the year around $80, then rose sharply in the wake of Russia’s war on Ukraine to a peak of $124 in June. The decline to a range of $80–$90 over the past three months is encouraging, but leaves prices very high relative to history, even when correcting for inflation.
Most recession probability models use a single variable, either the 10 year-2 year or 10 year-3 month yield curve slopes described above. The implication of using yield curve slopes to predict a recession implies that recessions are caused by Fed monetary policy and the interplay with economic growth and inflation.
There is a strong argument (and plenty of research) that oil price shocks lead to recessions. In fact, the attribution to monetary policy versus oil has been challenging because yield curve inversions and oil price spikes have both happened before each recession in the post-war period.
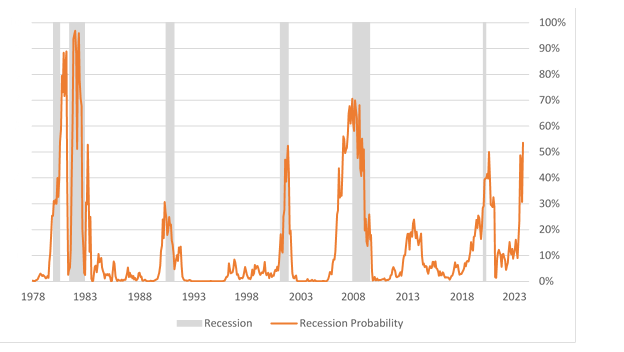
We have created a proprietary recession probability model that incorporates both signals to predict recession 12 months ahead. The model will be detailed in an upcoming thought leadership paper and uses the 10 year-3 month yield curve slope and the price of oil, adjusted for inflation. The results are shown in Figure 3.
As of October 2022, the model shows a 54% probability of recession over the next 12 months, the highest since the global financial crisis of 2008–2009. Note the probabilities in the scenarios above are not derived directly from this model. We recognize the unique nature of today’s environment, including the pandemic, fiscal stimulus, inflation, and Federal Reserve response that make historical relationships less reliable. Nevertheless, the signal from this model is consistent with our assessment above.
Figure 3: Recession probability* is elevated
Probability of recession occurring 12 months forward

*Based on slope of yield curve (10-year yield minus 3-month yield) and inflation-adjusted oil price.
Data through October 2022, projecting probability 12 months forward to October 2023.
Core narrative
An increasingly hawkish Fed and persistent inflation continue to challenge markets, and we now expect a mild economic recession in 2023. The key driver is a Fed that moves interest rates into increasingly restrictive territory, putting a pinch on business capital expenditures and consumer spending. The inversion of the yield curve along with an elevated oil price show a rising probability of recession in our model, which fits with our other analyses, qualitative judgement, and signals in corporate earnings guidance and surveys of CEO sentiment. We expect a deceleration in inflation going forward, but not quickly enough for the Fed to slow hikes soon nor reduce rates significantly in 2023.
Despite our expectation of a mild recession, we are not moving to a more defensive posture in portfolios. Equities could see further downside and continued choppiness into next year. If the mild recession does indeed transpire, we would expect a decline of 10%–15% for U.S. large-cap equities, down roughly to the lows registered in mid-October of this year. However, it is incredibly difficult to time the market. Significantly reducing risk from equities requires timing not only the exit from but also the return to the equity market. History tells us that the equity market will bottom before the backdrop improves in a convincing manner. In fact, it is common for the equity market to bottom early in or even just before the onset of a recession. The bounce off the bottom is often violent, and missing these strong days can significantly detract from long-term wealth creation. We are staying invested but looking for opportunities across regions (favoring the U.S. over international developed) and factors (tilting slightly toward growth, quality, and lower volatility). Should the market move sharply higher or lower without a commensurate change to our view of the risks, we will adjust portfolios accordingly.
S&P 500 index measures the stock performance of 500 large companies listed on stock exchanges in the U.S. and is one of the most commonly followed equity indices.
Wilmington Trust is a registered service mark used in connection with various fiduciary and non-fiduciary services offered by certain subsidiaries of M&T Bank Corporation including, but not limited to, Manufacturers & Traders Trust Company (M&T Bank), Wilmington Trust Company (WTC) operating in Delaware only, Wilmington Trust, N.A. (WTNA), Wilmington Trust Investment Advisors, Inc. (WTIA), Wilmington Funds Management Corporation (WFMC), and Wilmington Trust Investment Management, LLC (WTIM). Such services include trustee, custodial, agency, investment management, and other services. International corporate and institutional services are offered through M&T Bank Corporation’s international subsidiaries. Loans, credit cards, retail and business deposits, and other business and personal banking services and products are offered by M&T Bank, Member FDIC.
Facts and views presented in this report have not been reviewed by, and may not reflect information known to, professionals in other business areas of Wilmington Trust or M&T Bank who may provide or seek to provide financial services to entities referred to in this report. M&T Bank and Wilmington Trust have established information barriers between their various business groups. As a result, M&T Bank and Wilmington Trust do not disclose certain client relationships with, or compensation received from, such entities in their reports.
The information on Wilmington Wire has been obtained from sources believed to be reliable, but its accuracy and completeness are not guaranteed. The opinions, estimates, and projections constitute the judgment of Wilmington Trust and are subject to change without notice. This commentary is for informational purposes only and is not intended as an offer or solicitation for the sale of any financial product or service or a recommendation or determination that any investment strategy is suitable for a specific investor. Investors should seek financial advice regarding the suitability of any investment strategy based on the investor’s objectives, financial situation, and particular needs. Diversification does not ensure a profit or guarantee against a loss. There is no assurance that any investment strategy will succeed.
Past performance cannot guarantee future results. Investing involves risk and you may incur a profit or a loss.
Indexes are not available for direct investment. Investment in a security or strategy designed to replicate the performance of an index will incur expenses such as management fees and transaction costs which will reduce returns.
Reference to the company names mentioned in this blog is merely for explaining the market view and should not be construed as investment advice or investment recommendations of those companies. Third party trademarks and brans are the property of their respective owners.
©2022 M&T Bank and its affiliates and subsidiaries. All rights reserved.
Stay Informed
Subscribe
Ideas, analysis, and perspectives to help you make your next move with confidence.
What can we help you with today