 Equal Housing Lender. © 2026 M&T Bank. NMLS #381076. Member FDIC. All rights reserved.
 Equal Housing Lender. © 2026 M&T Bank. NMLS #381076. Member FDIC. All rights reserved.
June 21, 2022—The market has been throttled by upside surprises to inflation, downside surprises to broader economic data, and a Fed scrambling to catch up before inflationary expectations run away. Pessimism is piling up among consumers, business executives, investors, and economists. We remain in the “no recession” camp over the next 12 months but recognize risks clouding the economic view. We are taking down risk slightly in portfolios, shifting a small allocation from leveraged loans and emerging markets equities to investment-grade fixed income.
Have we seen the worst?
Attempting to call the bottom in the market is a common pastime of the financial media but not recommended for investors. Yet the pain experienced in financial markets so far this year has many wondering if the worst is behind us. With the S&P 500 pulling back 22% from its January high and investment-grade muni bonds down 8.3%, the paper losses (or an unrealized loss) for a 60/40 stock/bond diversified investor are approximately -18% year-to-date[1]. Investors are trained to expect and stomach volatility in stocks— which has actually remained remarkably contained with the VIX volatility index only briefly breaching 35 so far this year*—but the volatility in the bond market has jolted investors typically accustomed to seeing their bond allocations provide stability in risk-off markets.
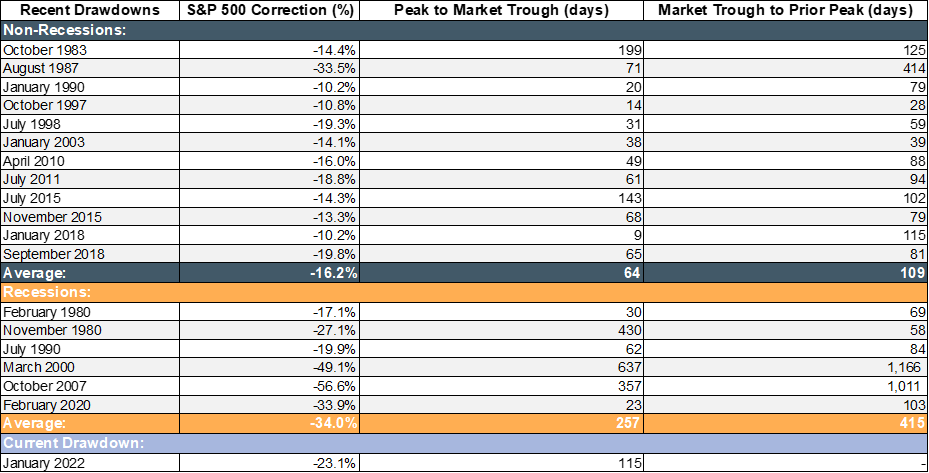
We continue to frame the debate around the market in terms of a growth scare versus a recession. We expect inflation to peak soon and to end the year around 5.5%–6.0% on the Consumer Price Index (CPI) year over year, with Growth Domestic Product (GDP) growth in 2022 of 2%. Our chief economist detailed our base case and risks in a recent Wilmington Wire post. If we are right that this is a growth scare or mid-cycle slowdown, then stocks would appear to be oversold. We analyzed all non-recessionary pullbacks in the S&P 500 in excess of 10% since 1980, and the average is -16%, with a relatively short 116 days to recover to the prior market peak (Figure 1).
However, recession risks are high enough that we need to contemplate what the market’s path could look like if in a downturn. Looking at recessions since 1980, the average pullback was -34%, and the market’s round trip took much longer at an average of 257 trading days on the way down and 415 on the way back up to the prior market peak. The recessionary data are skewed by the 2000 and 2007 recessions, which represented a bubble in tech valuations and a financial crisis, respectively. We think any potential recession would be relatively short and shallow, so the market has potentially already sufficiently priced a recession. However, the speed and degree of liquidity being withdrawn from the market in the form of more restrictive monetary policy and tightening financial conditions could result in further contraction in financial asset valuations.
Figure 1: Profile of a bear market

Data as of June 14, 2022. Sources: Bloomberg and WTIA.
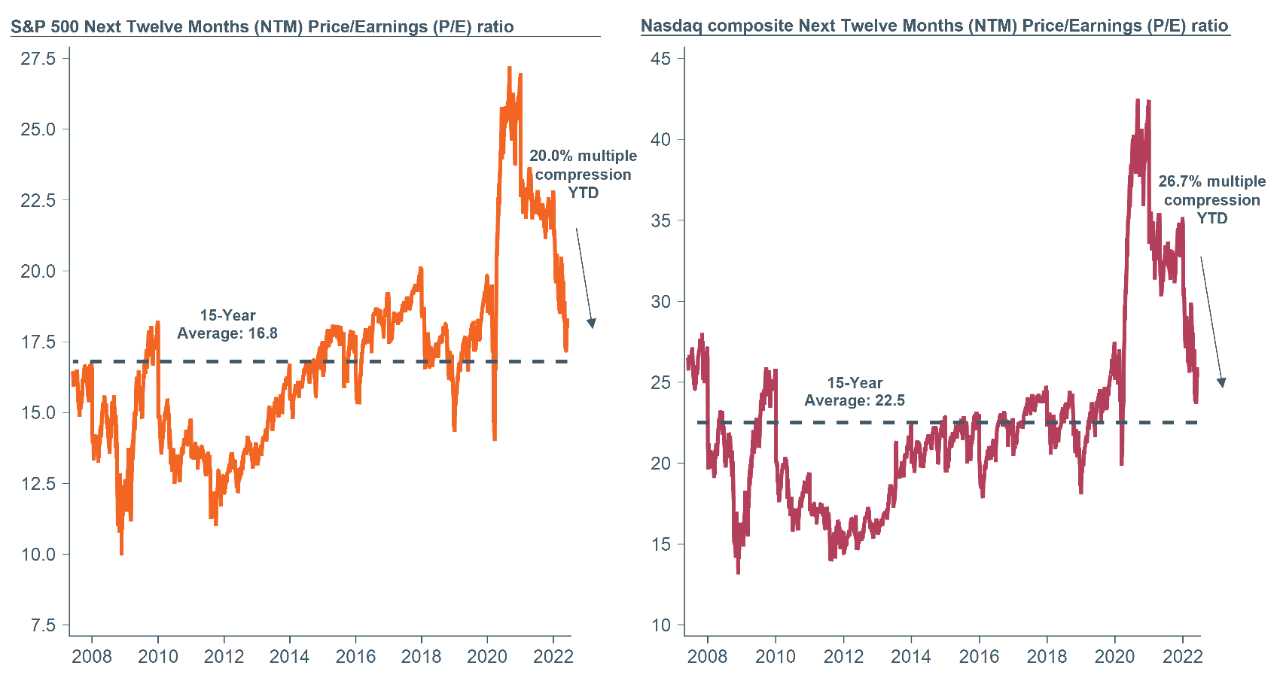
Key to the near-term performance of the market will be the upcoming earnings season, starting in just three weeks, and how firms and analysts alike will react to the unfolding slowdown. Equity valuations have thus far contracted nearly 30%, but earnings estimates have yet to be revised down by analysts, which means that 16x multiple on the S&P 500’s next-12-month earnings may not be as cheap as it looks. (Figure 2; the historical average P/E over the last 15 years has been 16.8x.) The second-quarter earnings season could yield disappointment even absent a recession as companies guide toward higher costs and lower revenues. Fiscal policy support is unlikely to come to the market’s rescue, and it could take convincing signs of slowing inflation and a more dovish Fed for stocks to give the “all clear.”
Figure 2: Valuations compressed but earnings at risk

Data as of May 31, 2022. Source: Bloomberg.
Modest risk reduction in portfolios
Emerging markets (EM) equities are one asset class where we have, until recently, seen opportunity. We now assess the asset class as vulnerable, though EM have held up better so far this year than other equity regions. China’s monetary, regulatory, and COVID policies have been the focus for the asset class over the last year. While signs appear to be turning more positive for Chinese fiscal support, the direction of policy remains unpredictable. As we consider the broader EM equity asset class, we recognize risks related to inflation (food inflation, in particular), dollar strength, global growth, and global monetary policy tightening. We are reducing our modest overweight to the asset class in a time of relative strength, bringing the asset class to neutral versus our strategic asset allocation. The proceeds are being allocated to investment-grade fixed income.
While the pain in stocks could continue, we think the worst is over for bonds. The 10-year Treasury yield is hovering around 3.3% at the time of writing. The market is pricing in another 2% of rate hikes from the Fed in 2022 and the 2-year Treasury yield has reached 3.2%[2]. While more aggressive Fed tightening cannot be ruled out, we would expect upside in the long end of the curve to be limited as investors increasingly trade additional rate hikes for recession risk. For tax-exempt investors, the municipal bond market has seen significant outflows despite municipalities remaining in good financial health. Short-duration leveraged loans have outperformed investment-grade fixed income but underperformed cash during year to date. We feel investment-grade fixed income offers better value at these levels than leveraged loans today (which would typically be expected to outperform in a rising-rate environment), and we are closing out our position in the latter to fund an increased weight in the former. Our allocation to investment-grade fixed income is now just modestly below the benchmark.
Core narrative
Uncertainty remains high. We retain a view that the U.S. will avoid recession in the next 12 months, but signals from the market suggest there could be more weakness ahead before equities find a sustainable bottom. We are recommending that clients avoid dramatic changes in their portfolio risk, as the equity market is likely closer to its bottom than the top and upside catalysts are often only clear in retrospect. Many investors will find their portfolios have drifted from their targeted allocations, and we believe it is the right time to rebalance portfolios back to target allocations as a prudent portfolio management strategy. Rebalancing today will, in most cases, result in buying within some equity asset classes. Over time, this strategy reinforces the “going against the grain” approach to investing, which has been shown to add value over long periods of time.
*When the Cboe Volatility Index (VIX) is above 20, volatility is expected to be higher than normal over the next 30 days.
[1] Source: Bloomberg. Data as of June 17, 2022.
[2] Source: Bloomberg. Data as of June 17, 2022.
Disclosures
Facts and views presented in this report have not been reviewed by, and may not reflect information known to, professionals in other business areas of Wilmington Trust or M&T Bank who may provide or seek to provide financial services to entities referred to in this report. M&T Bank and Wilmington Trust have established information barriers between their various business groups. As a result, M&T Bank and Wilmington Trust do not disclose certain client relationships with, or compensation received from, such entities in their reports.
The information on Wilmington Wire has been obtained from sources believed to be reliable, but its accuracy and completeness are not guaranteed. The opinions, estimates, and projections constitute the judgment of Wilmington Trust and are subject to change without notice. This commentary is for informational purposes only and is not intended as an offer or solicitation for the sale of any financial product or service or a recommendation or determination that any investment strategy is suitable for a specific investor. Investors should seek financial advice regarding the suitability of any investment strategy based on the investor’s objectives, financial situation, and particular needs. Diversification does not ensure a profit or guarantee against a loss. There is no assurance that any investment strategy will succeed.
Past performance cannot guarantee future results. Investing involves risk and you may incur a profit or a loss.
Indexes are not available for direct investment. Investment in a security or strategy designed to replicate the performance of an index will incur expenses such as management fees and transaction costs which will reduce returns.
Reference to the company names mentioned in this blog is merely for explaining the market view and should not be construed as investment advice or investment recommendations of those companies. Third party trademarks and brands are the property of their respective owners.
S&P 500 index measures the performance of approximately 500 widely held common stocks listed on U.S. exchanges. Most of the stocks in the index are large-capitalization U.S. issues. The index accounts for roughly 75% of the total market capitalization of all U.S. equities.
Municipal bonds typically provide a lower yield than comparable taxable bonds in consideration of the tax-advantaged status of the interest payments from these bonds, which are exempt from federal taxes and may be exempt from applicable state and/or local taxes in the states and/or municipalities where they were issued. Capital gains do not share this tax-advantaged status. Investments in municipal securities may not be appropriate for all investors, particularly those who do not stand to benefit from the tax status of the investment. The Alternative Minimum Tax may negate some or all of the tax benefits available through municipal securities.
Fixed Income Risks Interest rate risk: Prices of fixed income securities rise and fall in response to changes in the interest rate paid by similar securities. Generally, when interest rates rise, prices of fixed income securities fall. However, market factors, such as the demand for particular fixed income securities, may cause the price of certain fixed income securities to fall while the price of other securities rise or remain unchanged. Interest rate changes have a greater effect on the price of fixed income securities with longer durations. Duration measures the price sensitivity of a fixed income security to changes in interest rates.
Credit risk: Fixed income securities carry the risk of default, which means that the security issuer fails to pay interest or principal when due. Many fixed income securities receive credit ratings from services such as Standard & Poor’s and Moody’s Investor Services, Inc. These services assign ratings to securities by assessing the likelihood of issuer default. Lower credit ratings correspond to higher credit risk.
Call risk: Call risk is the possibility that an issuer may redeem a fixed income security before maturity (a call) at a price below its current market price. An increase in the likelihood of a call may reduce the security’s price.
References to specific securities are not intended and should not be relied upon as the basis for anyone to buy, sell, or hold any security. Holdings and sector allocations may not be representative of the portfolio manager’s current or future investment and are subject to change at any time.
Stay Informed
Subscribe
Ideas, analysis, and perspectives to help you make your next move with confidence.
What can we help you with today