 Equal Housing Lender. © 2026 M&T Bank. NMLS #381076. Member FDIC. All rights reserved.
 Equal Housing Lender. © 2026 M&T Bank. NMLS #381076. Member FDIC. All rights reserved.
January 28, 2022—Equity markets stumbled out of the gate in 2022 with U.S. tech-related shares hit hardest. Several factors are driving elevated volatility and investor angst, including geopolitics, disappointing earnings, and increased hawkishness from central banks. While equity market corrections can be unsettling, they can also provide opportunities for long-term investors. We have taken the opportunity to deploy cash into market weakness on a constructive view of the economy and equity markets over the next 9–12 months. Specifically, we have added modestly to existing overweight positions in U.S. large- and small-cap equities, while also allocating 1% (in Growth & Income risk profiles) to leveraged loans.
Market selloff
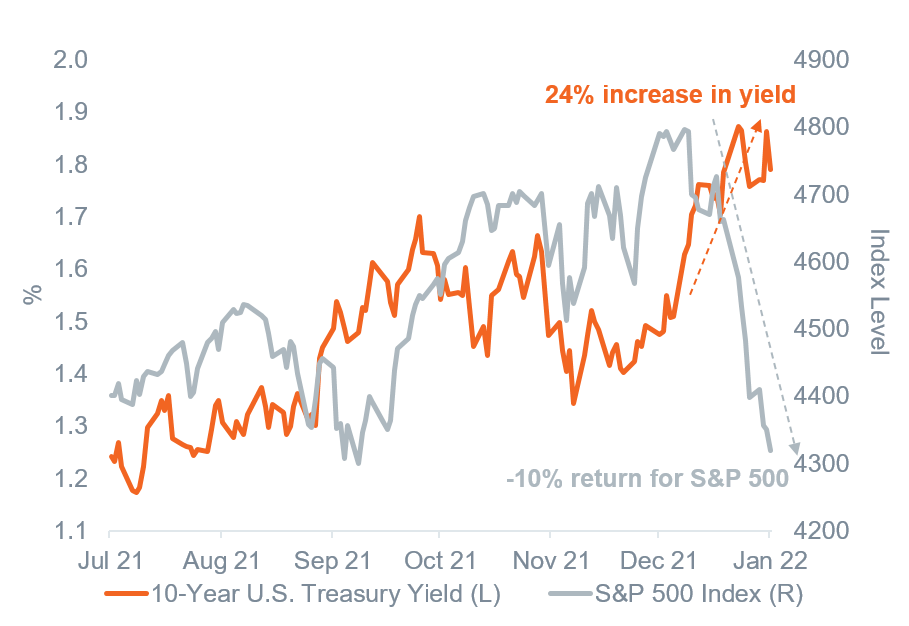
The calendar turned to a new year, the S&P 500 hit a new all-time high, and it’s been downhill since. Three factors have been at work: a change in tone from the Fed, geopolitical risk, and disappointing earnings. A more hawkish tone from the Federal Reserve (Fed) contributed to a repricing of interest rates (more on this below) and the 10-year Treasury yield rapidly increased 30 basis points, or bps from the start of the year to 1.875% on January 18—a nearly 25% yield increase in 11 trading days (Figure 1).
Figure 1: Yields moving up, equities moving down
10-year U.S. Treasury yield and S&P 500 index

Past performance cannot guarantee future results. Indexes are not available for direct investment. Investment in a security or strategy designed to replicate the performance of an index will incur expenses such as management fees and transaction costs which will reduce returns.
Data as of January 27, 2022. Sources: Bloomberg, WTIA.
Investors quickly soured on growthier, tech-related companies with expensive valuations that are most exposed to rising interest rates. This pessimism grew as geopolitical risks escalated and the fourth-quarter earnings season revealed some disappointments, quickly spilling into the broader index. Year to date, only the energy sector—which is up 13.5% year to date—has been spared, as elevated geopolitical risk and a 16% increase in the price of Brent crude oil supported the sector. The S&P 500 index has now corrected -10% through mid-day January 27, with the tech-heavy Nasdaq Composite index down -14% year to date and -16% from its mid-November all-time high. This is well within the norm of historic volatility, but after 2021’s steady climb higher with barely a 5% correction, it is certainly jarring to some investors to experience a pullback this early into the new calendar year.
Geopolitical risks are notoriously difficult to handicap, and the developing crisis in Russia/Ukraine is no different. Even if we knew the outcome, the magnitude of financial market impact would be challenging to quantify, though we would expect a higher geopolitical risk premium to keep volatility elevated. From an investment point of view, the asset class most exposed is international developed equities—Europe, in particular. The region has been reeling from the last wave of COVID-19 and elevated energy prices. A prolonged conflict on the border of Ukraine that threatens Europe’s natural gas supply could result in an energy crisis with spillover risks to economic growth. While Europe’s direct revenue ties to Russia are estimated at less than 2%[1], the continent has become increasingly reliant on Russian natural gas in recent years. Gazprom—Russia’s energy corporation—alone provided more than 30% of European natural gas demand in 2020 (according to Bloomberg). We hold an overweight to international developed equities and are monitoring the situation closely.
Fourth-quarter earnings season has also gotten off to a bit of a rocky start with some notable disappointments, though approximately two-thirds of the S&P 500 by market capitalization have yet to report, and the index is still projected to grow earnings by more than 20%. Earnings and revenue beats are above the five-year average thus far but well below the magnitude of positive surprises seen in the pandemic recovery. The themes from company management are clear: rising input costs, supply-chain disruptions, and virus-related headwinds to consumer activity. The key will be earnings guidance for the remainder of the year, which must factor in a slowing consumer, tighter Fed policy, and continued supply-chain challenges.
Of the three factors mentioned above, the path of monetary policy from the Fed is probably the most impactful for the year ahead. Not only does the inflation backdrop and balance sheet composition put the Fed in uncharted territory, but U.S. monetary policy relative to global policy will likely have implications for the U.S. dollar and regional equity leadership.
Ramping up rate hikes
The Federal Open Market Committee (FOMC) of the Fed and Chair Powell kicked off 2022 by confirming expectations of its first interest rate hike in March 2022 and ramping up expectations of a steeper path than previously communicated. As we wrote last month, the Fed moved to a more hawkish position over the last three months of 2021 as inflation continued moving higher. Over the course of January 2022—even before this week’s FOMC meeting—markets had priced in faster and more aggressive Fed tightening. Fed funds futures accelerated the first expected hike (0.25%) of the federal funds rate from May to March and added a fourth hike in 2022. After this week’s FOMC meeting, rate hike expectations have now moved even higher.
Anyone would be forgiven if they only read this week’s official meeting statement and concluded very little change in the Fed’s stance. It was Chair Powell who shifted the market’s mood during his post-meeting press conference. We have two broad takeaways from the press conference: 1) there is a bias on the committee to increase the expected number of hikes this year, and 2) the FOMC is placing much more emphasis on rate hikes than on balance sheet reductions.
More rate hikes
An unmistakable takeaway from the press conference is that Chair Powell expects committee members to raise their individual forecasts of rate hikes in 2022 (the median is currently at three). He indicated an inclination to raise his inflation forecast, that the risks were to the upside, and that he expected other committee members would update their forecasts, strongly implying upward revisions. We doubt he would make that suggestion without the consent of his colleagues and we expect to see confirmation of a higher expected rate hike path in the weeks ahead as committee members hit the speaking circuit.
Powell is careful and avoids committing to dates or other specifics that have not been decided by the full committee, but he clearly and repeatedly suggested that investors should be ready for the possibility of a steeper rate hike path than the one 0.25%-hike-per-quarter that transpired in 2017–2018 and has been a baseline expectation for many (including us). One hike per quarter corresponds to a hike at every other meeting. When asked multiple times about the possibility for more frequent hikes or by larger increments, Powell refused to answer explicitly, did not push back on the idea, and then listed all of the reasons that the current economy is strikingly different from that of 2017–2018: stronger economic growth, higher inflation, and a very tight labor market. The implication is obvious that investors should not dismiss the possibility of a steeper rate path.
We think the first rate hike will come at the March 16 meeting and will be 0.25%. We’re currently expecting four hikes in 2022. As described above, Powell exerted some effort to prepare markets for the possibility of even more, but that is different from a baseline expectation. We think inflation is set to slow sharply this year (discussed in detail below) and will justify the four hikes. There is certainly risk of higher inflation and that would indeed lead to a faster pace.
Rate hikes versus balance sheet
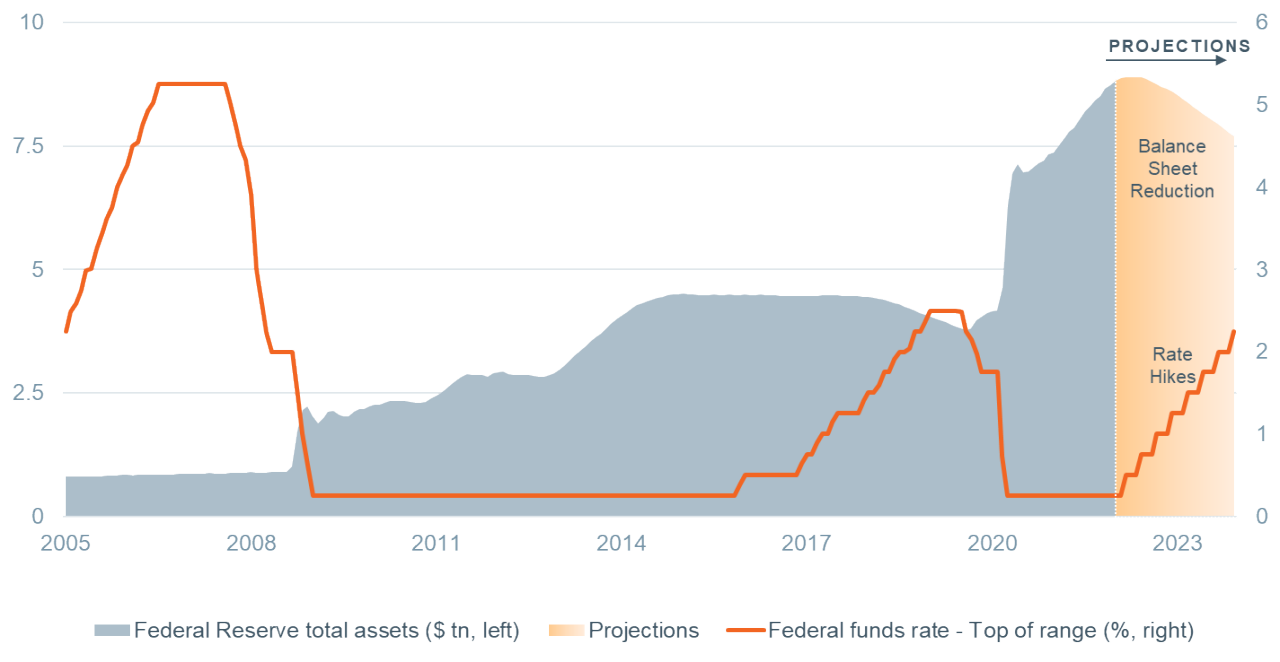
In addition to keeping short-term interest rates low, the Fed has been supporting the economy by purchasing vast quantities of U.S. Treasuries and mortgage-backed securities (MBS) to push down longer-term interest rates. That process, known as Quantitative Easing (QE), increased their overall balance sheet to nearly $9 trillion from a starting point of $4.2 trillion on the eve of the pandemic. Such a large balance sheet is potentially inflationary, and the Fed is looking to reduce it (just as it did in the previous cycle from 2017 to 2019). The precise impacts are unknown, but when the Fed backs away from being a key buyer of Treasuries and MBS, it should push longer-term rates higher.
Financial market participants, in general, expected this process to start sometime after 2022 until the minutes of the FOMC’s December 2021 meeting were released. Those minutes showed the FOMC was keen on starting balance sheet reduction in 2022, and we believe this new expectation contributed to volatility in markets. Importantly, many market participants foresaw the Fed using rate hikes and balance sheet reductions as complementary tools, calibrated to work in tandem to tighten financial conditions. Chair Powell appeared to reverse that notion, repeatedly stressing that rate hikes are the primary tool and that balance sheet reduction would be “running in the background.” The takeaway is the Fed will be hiking short-term rates more than it would if it viewed the balance sheet as an active tightening tool (Figure 2).
Figure 2: Federal Reserve balance sheet ($ trillions, left) and federal funds rate (%, right)

Sources: Federal Reserve Board of Governors, Bloomberg, WTIA.
Inflation: all eyes on upside pressures
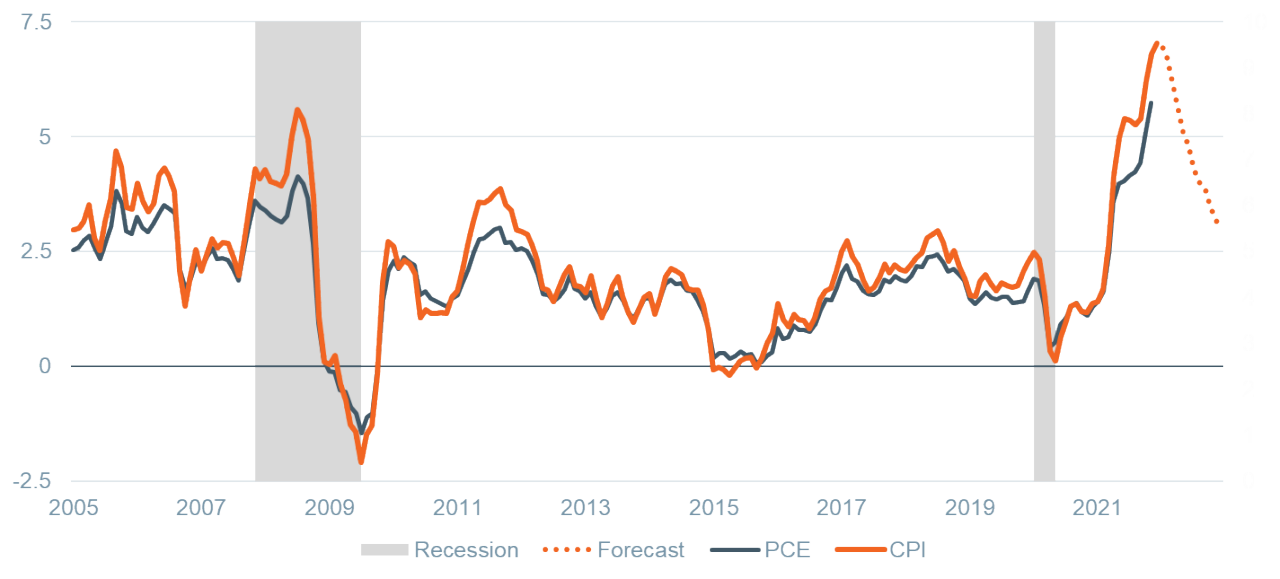
Headline consumer price index (CPI) inflation has climbed to its highest (7.0%) level since the early 1980s, and core inflation (ex-energy and food) is at its most elevated (5.5%) since the early 1990s, coming from two distinct periods in 2021. The Fed interpreted the first, three-month spike in prices in spring 2021 as “transitory” (a term that has dogged them since). It was driven by a handful of categories (hotels, airfares, and used cars—each a tiny share of the CPI basket) that surged upon reopening only to vanish in the subsequent three months. Inflationary pressures then broadened from October to December as a result of supply-chain disruptions and surging wages. That timing corresponded with the Fed’s notable shift at the December 2021 FOMC meeting, providing further evidence that the path of inflation will determine the number of rate hikes this year. We expect inflation will ease to 3% by the end of 2022 as stimulus- and virus-driven demand fades and supply-chain pressures ease (Figure 3).
There are, however, three key upside risks for inflation:
Figure 3: Inflation as measured by Consumer Price Index (CPI) and Personal Consumption Expenditures (PCE) (year-over-year%) and WTIA forecast of CPI

Sources: Bureau of Labor Statistics, Bureau of Economic Analysis, WTIA.
Core narrative
We maintain a positive outlook for the U.S. and global economies in 2022 and have used the recent market weakness to deploy excess cash into U.S. equities and leveraged loans. In October, we elevated cash holdings in client portfolios to an above-benchmark position on expectations for higher volatility, and the reset of U.S. equity valuations gave us an opportunity to add to existing overweight positions in U.S. large- and small-cap equities. Economic growth in the U.S. is certainly slowing from 2021’s robust pace, but we expect GDP to expand by 3% in 2022—still above the historical average and strong enough to sustain the early innings of the Fed’s rate-hike cycle. Leveraged loans also provide an opportunity for better risk-adjusted returns in a rising-rate environment than cash. These securities provide an attractive yield, short duration, and a coupon that adjusts with short-term interest rates, helping to mitigate interest-rate risk. While credit spreads for below-investment-grade securities are tight, we do not anticipate material spread widening in a healthy economy.
Inflation is the main risk that could force the Fed to act even more aggressively to cool the economy. Fed policy should result in higher short-term interest rates, while we expect the 10-year Treasury yield to end 2022 between 2.0% and 2.5%. The key will be whether the Fed can tighten policy without quickly inverting the yield curve. We expect equities to outperform fixed income in the year ahead but likely with continued elevated volatility. We currently hold overweight positions across all major equity asset classes, with a slight preference for international equities given more favorable growth trajectories, monetary and fiscal policies, and valuations.
[1] Source: Morgan Stanley.
Disclosures
Facts and views presented in this report have not been reviewed by, and may not reflect information known to, professionals in other business areas of Wilmington Trust or M&T Bank who may provide or seek to provide financial services to entities referred to in this report. M&T Bank and Wilmington Trust have established information barriers between their various business groups. As a result, M&T Bank and Wilmington Trust do not disclose certain client relationships with, or compensation received from, such entities in their reports.
The information on Wilmington Wire has been obtained from sources believed to be reliable, but its accuracy and completeness are not guaranteed. The opinions, estimates, and projections constitute the judgment of Wilmington Trust and are subject to change without notice. This commentary is for informational purposes only and is not intended as an offer or solicitation for the sale of any financial product or service or a recommendation or determination that any investment strategy is suitable for a specific investor. Investors should seek financial advice regarding the suitability of any investment strategy based on the investor’s objectives, financial situation, and particular needs. Diversification does not ensure a profit or guarantee against a loss. There is no assurance that any investment strategy will succeed.
Past performance cannot guarantee future results. Investing involves risk and you may incur a profit or a loss.
Indexes are not available for direct investment.
Reference to the company names mentioned in this blog is merely for explaining the markets view and should not be construed as investment advice or investment recommendations of those companies. Third party trademarks and brands are the property of their respective owners.
S&P 500 index measures the performance of approximately 500 widely held common stocks listed on U.S. exchanges. Most of the stocks in the index are large-capitalization U.S. issues. The index accounts for roughly 75% of the total market capitalization of all U.S. equities.
Stay Informed
Subscribe
Ideas, analysis, and perspectives to help you make your next move with confidence.
What can we help you with today