 Equal Housing Lender. © 2026 M&T Bank. NMLS #381076. Member FDIC. All rights reserved.
 Equal Housing Lender. © 2026 M&T Bank. NMLS #381076. Member FDIC. All rights reserved.
May 4, 2021—Equity markets have come a long way since suffering a 33% bear market decline at the onset of the COVID-19 pandemic in March 2020. Over the 13 months that followed, the S&P 500 not only reclaimed its pre-pandemic peak in August but went on to print over 40 record highs, with 9 of them occurring in April alone. Most who invested in equities at that time and participated in the remarkable 90% gain that followed are undoubtedly glad to have bought the dip, but what about those with dry powder to invest today? Does it make sense to deploy fresh capital into the market with most major indices hitting all-time records on an almost weekly basis? Interestingly, history has shown that a new market all-time high has been just as good a time as ever to put new money to work.
Investing at market highs has a surprisingly strong track record
There is inherently something frightening about investing after the market has run up significantly. The possibility of buying at the exact wrong time and witnessing an immediate loss in value is a difficult thought for anyone to stomach. To help quantify the tradeoffs of investing in the current climate, we reviewed over nine decades of S&P 500 returns and found that the optimal outcome may be best achieved by overcoming our fear of heights.
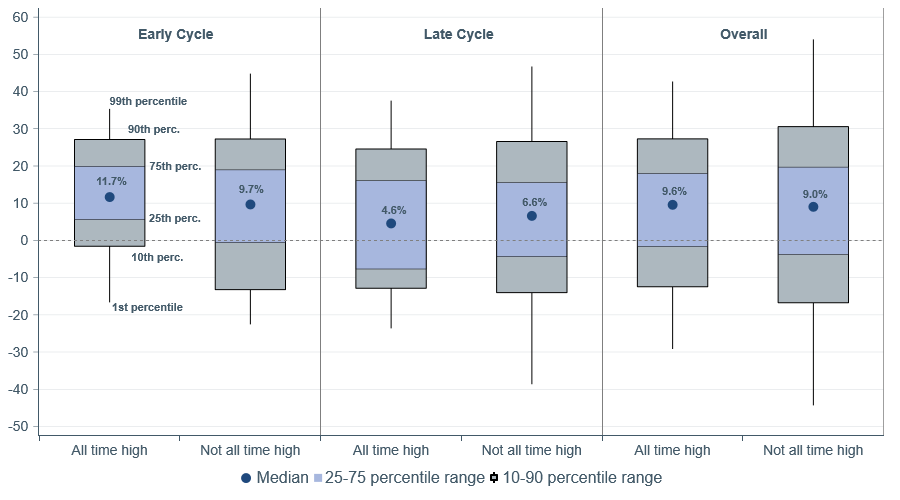
To start, we split S&P 500 forward 12-month returns into two categories—days where the index hit an all-time high and all other trading days going back to 1928. Interestingly, as shown on the right side of Figure 1 below, the distributions of returns between all-time high days and all others have been comparable. In fact, performance has been slightly better on average when the index was hitting a new record, with a median return of 9.6% versus 9% for all other days. On all-time high days, performance over the subsequent 12-month periods exhibited a more positive bias, with returns exceeding zero 72% of the time vs. 69% for all other days. This is not to suggest that we should consider if the market is hitting a new record as a sole indicator of whether it’s a good time to invest, but the numbers suggest that it shouldn’t necessarily be a reason not to.
Figure 1: S&P 500 1-yr forward returns: all-time highs vs. non-all-time highs by stage of business cycle

Figure 1 shows the distribution of S&P 500 forward 12-month price returns from days when the index hit all-time highs and all other trading days from 1928 through April 30, 2021 partitioned by stage of economic expansion. Early cycle and late cycle refer to the first and second half of expansions, characterized as periods between NBER designated recessions. Right side shows the performance distribution for all observations. Sources: National Bureau of Economic Research, WTIA, Macrobond.
Forward return results will vary for time periods other than 12-months.
Past performance cannot guarantee future results. Indexes are not available for direct investment. Investment in a security or strategy designed to replicate the performance of an index will incur expenses such as management fees and transaction costs which will reduce returns.
Early cycle tailwinds
The question of whether to invest at all-time highs is a bit more nuanced when the economic cycle is in its final innings, and the risk of an approaching recession is a more immediate concern. However, we find ourselves in a much different predicament today, having recently turned the page on the COVID-19 recession and as a new economic cycle commences. To incorporate the current early-cycle dynamics, we took our analysis above one step further to examine whether the range of performance outcomes of investing at new highs has varied at different stages of economic expansions. After splitting all market cycles in two, we found that investing at all-time highs has indeed yielded better outcomes in the first half of the expansion (Figure 1), with a median return of 11.7% over the next 12-months versus 4.6% in the second half. The first half also brought a more significant positive skew, with positive returns observed 87% of the time versus 58% in the second half.
The results reflect how the probability of the worst possible outcome, an economic recession, is far lower in a business cycle’s early stages. Those hesitant to invest at this time may want to consider that contrary to a mature expansion, when growth is typically slowing and policy is tightening, the global economy is currently on the rebound, policy is highly accommodative, and we expect to see the highest GDP growth in several decades in 2021. Although the near-term path forward remains uncertain, one thing we can say with a fair amount of confidence is that the early stages of the cycle have historically provided the most favorable backdrop for equities, and investors with a long time horizon are better off getting involved right away rather than waiting.
The opportunity cost of waiting for a pullback can be substantial
With any major purchase in life, whether it be a new car, home, or flat-screen TV, there is a sense of comfort that comes with locking in a bargain. For equity investing it is no different, and the past year has shown that a bear market decline can unveil the buying opportunity of a lifetime. An investment in the S&P 500 on March 23, 2020, the trough of the pandemic-induced selloff, would have reaped an eye-popping gain of over 90% through the current week. With recent proof that a well-timed, opportunistic purchase after a steep market drop can generate an immense windfall, why not just wait for another pullback to deploy fresh funds?
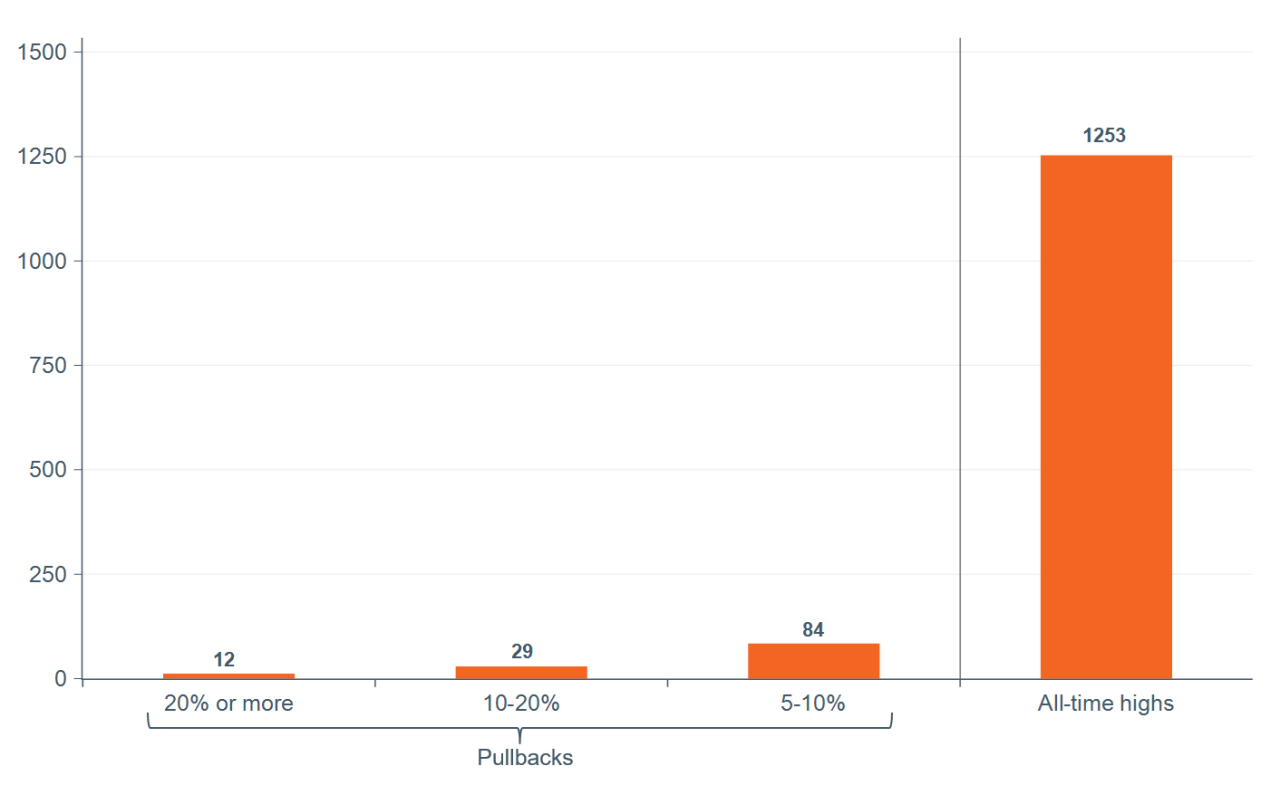
The issue with waiting for another comparable homerun opportunity is that bear markets are relatively rare. There have only been 12 market declines of over 20% since 1945. Even 5% drawdowns aren’t particularly frequent. As shown in Figure 2, S&P 500 all-time highs have outnumbered pullbacks of 5% or more by 10-to-1 over the same period, and hence waiting for a 5–10% decline brings the risk of missing out on significant upside in the interim. The last several months have delivered an excellent example of the opportunity cost of waiting. The S&P 500 hasn’t recorded a 5% drawdown in roughly 130 trading days (October 26), a period in which the index hit 36 all-time highs. An investor waiting on the sidelines would have regrettably missed out on a 24% gain over that span.
Figure 2: S&P 500 total all-time highs and pullbacks of 5% or more since 1945

Sources: Ned Davis Research, WTIA, Macrobond. Data as of April 30, 2021.
Core narrative
It is important to remember that the long-term path of least resistance for equities has generally been higher. Equities also tend to move in the same direction as GDP, which, other than in recessions, is typically growing. As a result, all-time highs are a frequent occurrence, have typically preceded further all-time highs, and is likely to continue to in the future. In fact, there have been over 1300 all-time highs since 1928, the large bulk of which turned out to be tremendous buying opportunities.
Notwithstanding, the “sleep at night” factor is important yet difficult to quantify. We can never rule out the prospect of the market moving against us and the anxieties it may cause. While historically it has been most profitable to invest cash all at once, for those concerned about the issues raised above, we generally advise creating a plan of phasing into the market over a period of three to nine months, sometimes called “tranching” into the market. Here the key is not the timespan or the number of investment tranches but rather creating a plan and sticking to it, to remove the psychological anguish of deciding the perfect time to invest. We encourage you to reach out to your advisor to discuss your personal situation.
Disclosures
Facts and views presented in this report have not been reviewed by, and may not reflect information known to, professionals in other business areas of Wilmington Trust or M&T Bank who may provide or seek to provide financial services to entities referred to in this report. M&T Bank and Wilmington Trust have established information barriers between their various business groups. As a result, M&T Bank and Wilmington Trust do not disclose certain client relationships with, or compensation received from, such entities in their reports.
The information on Wilmington Wire has been obtained from sources believed to be reliable, but its accuracy and completeness are not guaranteed. The opinions, estimates, and projections constitute the judgment of Wilmington Trust and are subject to change without notice. This commentary is for informational purposes only and is not intended as an offer or solicitation for the sale of any financial product or service or a recommendation or determination that any investment strategy is suitable for a specific investor. Investors should seek financial advice regarding the suitability of any investment strategy based on the investor’s objectives, financial situation, and particular needs. Diversification does not ensure a profit or guarantee against a loss. There is no assurance that any investment strategy will succeed.
Past performance cannot guarantee future results. Investing involves risk and you may incur a profit or a loss.
Indexes are not available for direct investment.
The S&P 500 Index is a market-capitalization-weighted index of the 500 largest U.S. publicly traded companies.
Stay Informed
Subscribe
Ideas, analysis, and perspectives to help you make your next move with confidence.
What can we help you with today