 Equal Housing Lender. © 2026 M&T Bank. NMLS #381076. Member FDIC. All rights reserved.
 Equal Housing Lender. © 2026 M&T Bank. NMLS #381076. Member FDIC. All rights reserved.
The eurozone economy continues to expand and inflation pressures remain high, likely bringing more rate hikes and downside risk for equities. Perhaps nothing in the global economy has been more surprising than the eurozone’s steady performance in the face of a major war, widespread pessimism, and a historic spike in energy prices last year. The economy did contract slightly in 4Q 2022, but then returned to growth to start the year. Inflation is not just high but surprised with a slight increase in April, despite the resolute monetary policy actions by the European Central Bank (ECB). Given persistent inflationary pressures, economic uncertainty, and the lag of the monetary policy transmission mechanism, we think the ECB is in the middle of a rate cycle, rather than the end. That brings downside risk to the economy and expected performance of international developed equities.
Inflation showing limited signs of dissipating
The eurozone inflation measure—Harmonized Index of Consumer Prices (HICP)—surprised with a slight increase from 6.9% to 7% in April, despite a slowdown in energy prices. Natural gas and electricity prices have helped bring overall inflation down thanks to a mercifully mild winter across the continent and an easing of supply-chain bottlenecks. Noting the high and persistent inflation in Europe, the ECB raised its policy rates by 25 basis point, or bps (0.25%) on May 4; this is a slowdown from the previous three hikes of 50bps each but still represents a historically unprecedented cumulative rise of 375bps in a span of 10 months. Despite the steep rise in interest rates, the pass-through of monetary policy to the real economy does not yet appear to be sufficient to bring down inflation. The restrictive policy may be taking hold, though, as early signs from the Bank Lending Survey (BLS) suggest that credit supply and demand are beginning to decline, and that should further weigh on growth.
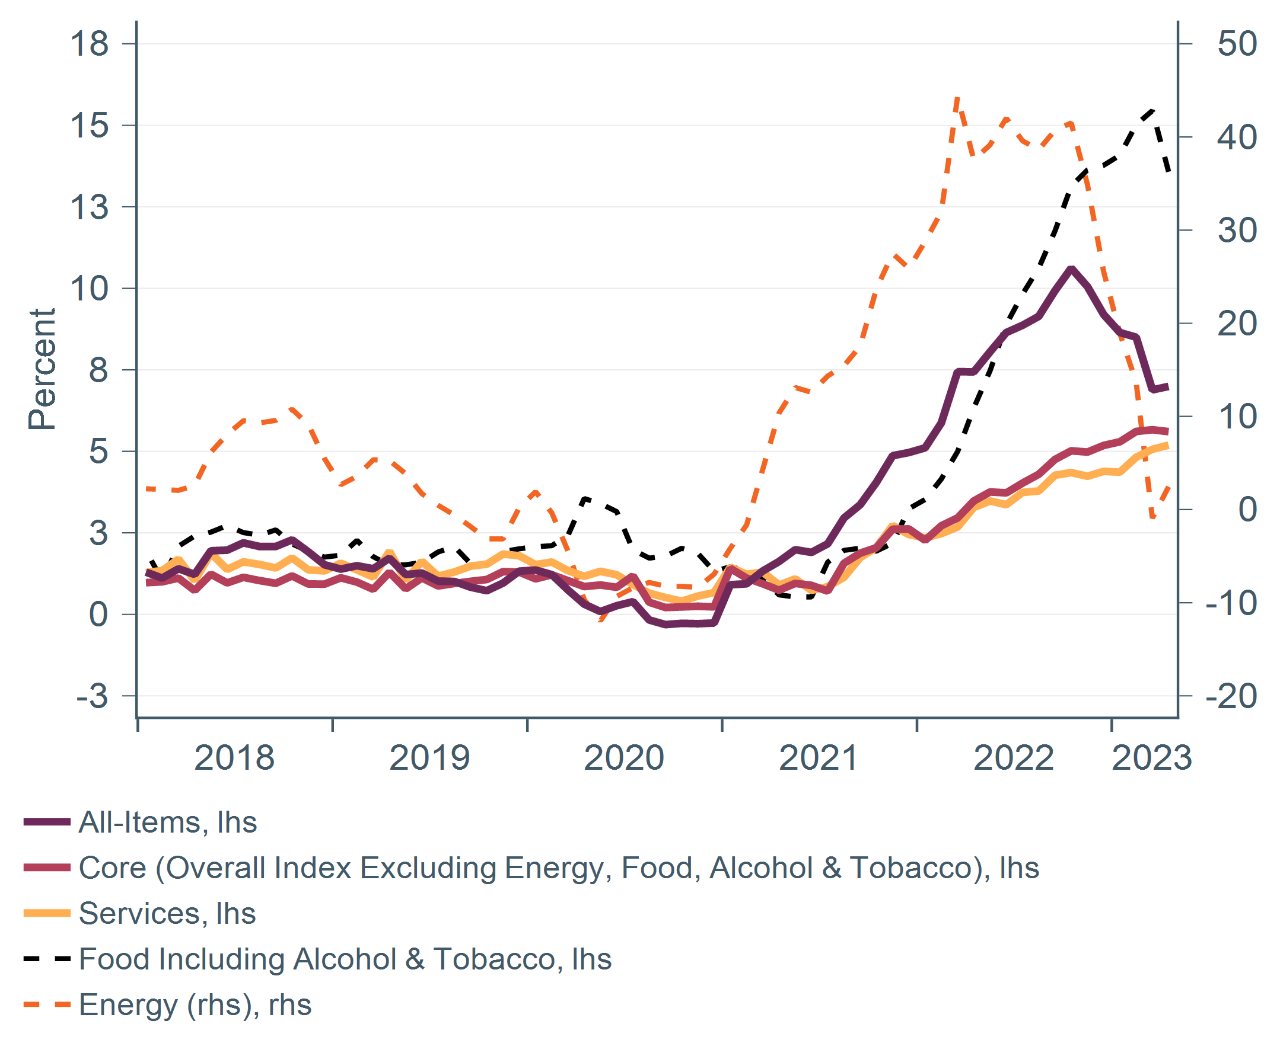
HICP inflation has encouragingly receded from the high of 10.6% in Oct. 2022, but at 7% in April 2023 remains considerably above the ECB target of 2%. The primary drivers of recent inflation have been energy and food prices, with the former increasing by 40% on an annual basis after the invasion of Ukraine. Since then, energy prices have started to come down partly due to a mild winter in Europe and the easing of supply bottlenecks.
Figure 1: Europe HICP change (y/y)

Source: Eurostat via Macrobond. Data as of April 30, 2023.
Food inflation remains high at 13.6% year over year (y/y) as of April 2023, a clear challenge for consumers as well as the ECB. Core inflation—which excludes energy, food, alcohol, and tobacco—may be leveling off, declining from 5.7% to 5.6% in April. Focusing just on consumer services, inflation rose slightly from 5.1% to 5.2% from March to April 2023. The ECB is projecting inflation to decline to 2.8% in 4Q 2023 although this projection is highly sensitive to developments in the oil and gas markets.
Tighter monetary policy not slowing the real economy enough
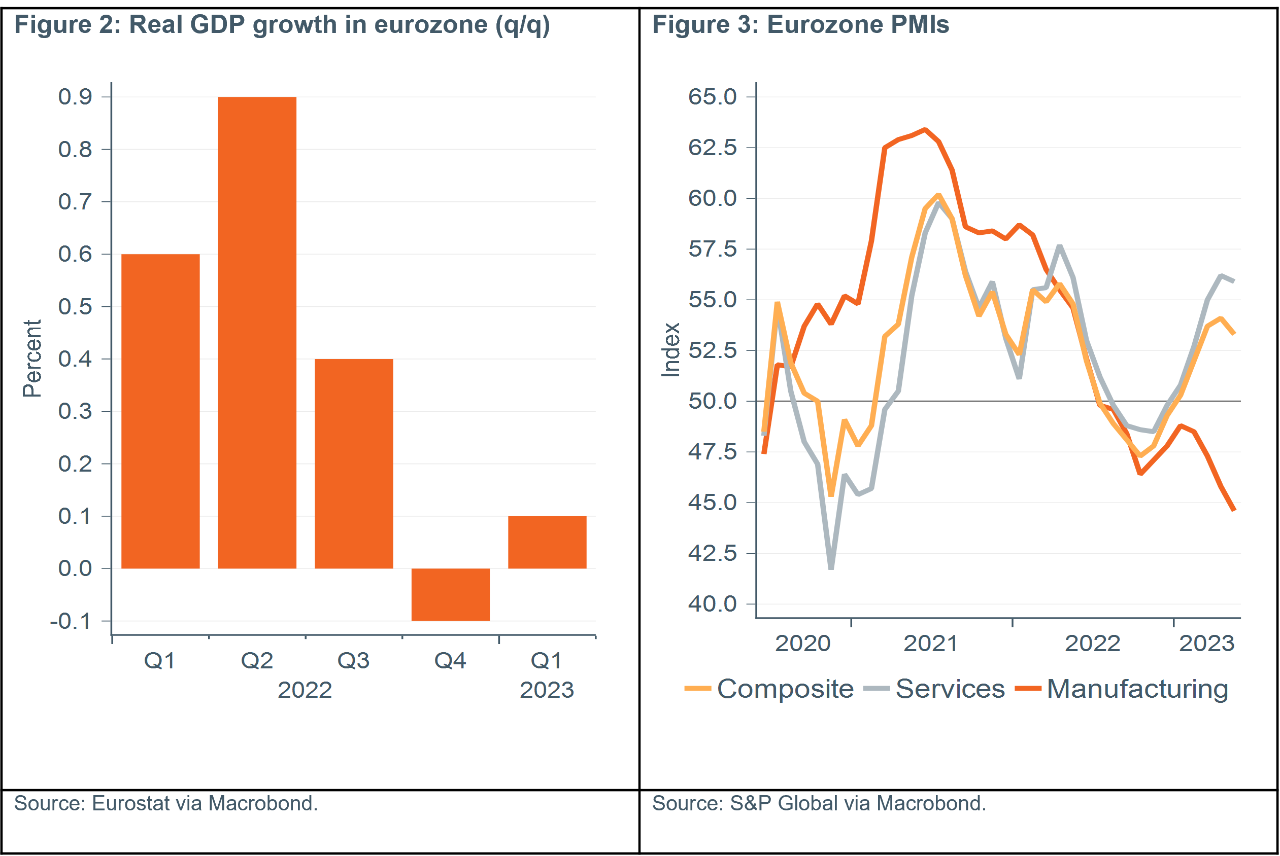
Real GDP slowed in the second half of 2022, from 0.9% quarter over quarter (q/q) in 2Q 2022 to a slight contraction of -0.1% percent in 4Q 2022 (Figure 2), a clear sign of the post-COVID GDP boost waning. However, the recent preliminary estimates from Eurostat show that the economy has picked up again with a 1Q 2023 growth rate of 0.1%. That improvement is also reflected in the survey data, such as the Purchasing Managers’ Indices (PMI), which pointed to higher economic growth. Since bottoming in October 2023, the composite PMI rose to 54.1 in April 2023 and declined slightly to 53.3 in May 2023 (any number above 50 indicates economic growth). However, the PMI measures disaggregated by sector gave a mixed signal with services showing growth while manufacturing indicated a contraction. The lack of a clear signal of a cooling economy suggests that the ECB might have more work to do and will likely continue to tighten monetary policy.

Data as of March 31, 2023.
Early signs of an impact on lending
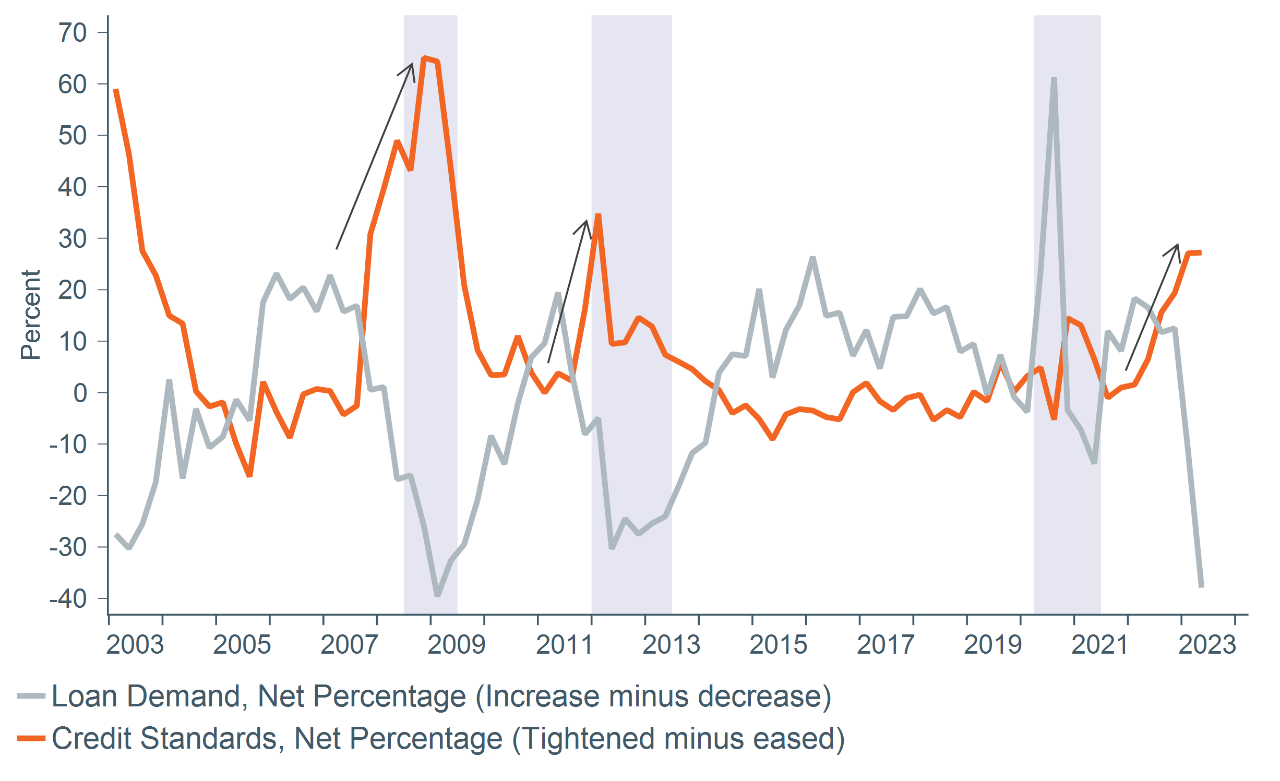
There are signals that the ECB’s monetary policy is having the desired impact on the financial conditions with lending cooling. A recent Bank Loan Survey (BLS) shows net tightening of credit standards as well as falling demand for loans (Figure 4). This decline in loan demand is driven by higher interest rates, lower fixed investments, and weakening housing markets. The decline in availability of credit is also partly explained by the recent financials sector turmoil—Credit Suisse’s collapse—as well the announcement by the ECB to accelerate its program of quantitative tightening (QT), effectively pulling liquidity from the financial system at a faster rate. This is expected to further tighten monetary conditions. QT refers to the unwinding of quantitative easing (QE), asset purchases made to push long-term rates lower when policy rates were constrained by the effective lower bound.*
Figure 4: ECB Bank lending survey: Credit standards and loan demand

Source: European Central Bank (ECB) via Macrobond. Data as of March 31, 2023.
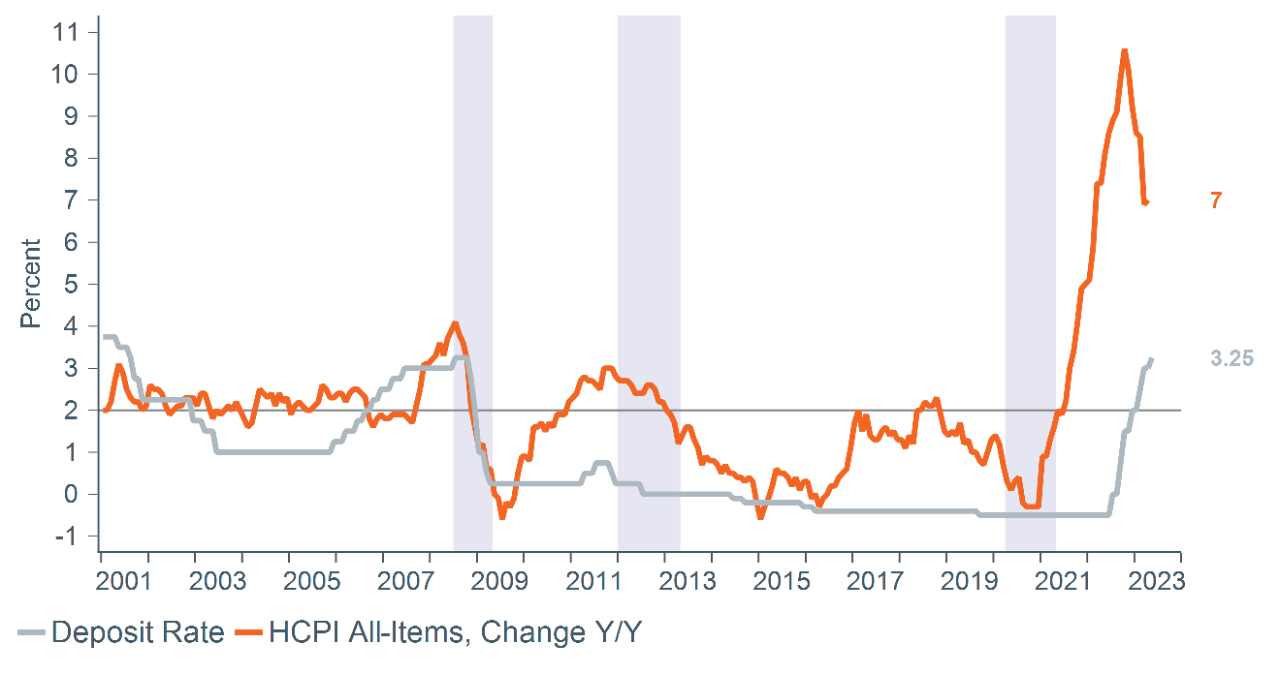
The ECB made it clear in its recent monetary policy statement that it is committed to the 2% inflation target and will ensure that policy rates remain sufficiently restrictive for as long as necessary to achieve this target. As shown in Figure 5, the sharp increase in inflation since 2Q 2022 garnered a strong monetary policy response from the ECB in the form of continuous rate hikes starting in July 2022. The change in the deposit rate from -0.5% to 3.25% in a span of fewer than 10 months is the sharpest increase in the 25-year history of the ECB. We expect the ECB will continue to raise rates by 25bps in the June and July meetings and then hold rates at those elevated levels for the remainder of 2023.
Figure 5: HICP inflation and ECB policy rate

Source: Eurostat and ECB via Macrobond. March 31, 2023.
This dramatic monetary policy response raises an important question: Will the ECB be able to bring inflation under control without causing a recession? Given high and persistent inflation, robust growth coupled with a hot labor market, as well as the lag of the monetary policy transmission mechanism, the risk to growth is skewed to the downside. The ECB’s fight could be a long one, with inflation—particularly food prices—showing few signs of retreat. We expect that a significant slowdown in economic activity will be needed to tame inflation, making it difficult to avoid a recession.
Core narrative
The ECB has shown a strong commitment to fighting inflation in Europe and has taken resolute steps in the form of unprecedent interest rate hikes. However, these higher rates have not yet cooled the economy enough to induce a significant decline in inflation. The ECB is walking a tightrope, and it is unclear if it will be able to bring inflation to its target of 2% without causing a recession. The significant economic slowdown needed to tame the high level of inflation will weigh on the real economy and bring downside risk to the performance of international developed equities. We hold an underweight to equities, both in U.S. small-cap and international developed asset classes, and an overweight to cash and fixed income.
* Effective lower bound refers to a situation where further monetary policy cuts are no longer effective at providing stimulus or can lead to adverse effects in the financials sector—interest rates cannot fall much below zero, since depositors have the option of holding cash at zero interest rather than a negative-yielding asset.
Definitions
Basis points refers to a common unit of measure for interest rates and other percentages in finance. One basis point is equal to 1/100th of 1%, or 0.01%, or 0.0001, and is used to denote the percentage change in a financial instrument.
Facts and views presented in this report have not been reviewed by, and may not reflect information known to, professionals in other business areas of Wilmington Trust or M&T Bank who may provide or seek to provide financial services to entities referred to in this report. M&T Bank and Wilmington Trust have established information barriers between their various business groups. As a result, M&T Bank and Wilmington Trust do not disclose certain client relationships with, or compensation received from, such entities in their reports.
The information on Wilmington Wire has been obtained from sources believed to be reliable, but its accuracy and completeness are not guaranteed. The opinions, estimates, and projections constitute the judgment of Wilmington Trust and are subject to change without notice. This commentary is for informational purposes only and is not intended as an offer or solicitation for the sale of any financial product or service or a recommendation or determination that any investment strategy is suitable for a specific investor. Investors should seek financial advice regarding the suitability of any investment strategy based on the investor’s objectives, financial situation, and particular needs. Diversification does not ensure a profit or guarantee against a loss. There is no assurance that any investment strategy will succeed.
Past performance cannot guarantee future results. Investing involves risk and you may incur a profit or a loss.
Indexes are not available for direct investment. Investment in a security or strategy designed to replicate the performance of an index will incur expenses such as management fees and transaction costs which will reduce returns.
Reference to the company names mentioned in this blog is merely for explaining the market view and should not be construed as investment advice or investment recommendations of those companies. Third party trademarks and brands are the property of their respective owners.
The gold industry can be significantly affected by international monetary and political developments as well as supply and demand for gold and operational costs associated with mining.
Stay Informed
Subscribe
Ideas, analysis, and perspectives to help you make your next move with confidence.
What can we help you with today