© 2024 M&T Bank and its affiliates and subsidiaries. All rights reserved.
Wilmington Trust is a registered service mark used in connection with various fiduciary and non-fiduciary services offered by certain subsidiaries of M&T Bank Corporation including, but not limited to, Manufacturers & Traders Trust Company (M&T Bank), Wilmington Trust Company (WTC) operating in Delaware only, Wilmington Trust, N.A. (WTNA), Wilmington Trust Investment Advisors, Inc. (WTIA), Wilmington Funds Management Corporation (WFMC), Wilmington Trust Asset Management, LLC (WTAM), and Wilmington Trust Investment Management, LLC (WTIM). Such services include trustee, custodial, agency, investment management, and other services. International corporate and institutional services are offered through M&T Bank Corporation’s international subsidiaries. Loans, credit cards, retail and business deposits, and other business and personal banking services and products are offered by M&T Bank. Member, FDIC. 
M&T Bank Corporation’s European subsidiaries (Wilmington Trust (UK) Limited, Wilmington Trust (London) Limited, Wilmington Trust SP Services (London) Limited, Wilmington Trust SP Services (Dublin) Limited, Wilmington Trust SP Services (Frankfurt) GmbH and Wilmington Trust SAS) provide international corporate and institutional services.
WTIA, WFMC, WTAM, and WTIM are investment advisors registered with the U.S. Securities and Exchange Commission (SEC). Registration with the SEC does not imply any level of skill or training. Additional Information about WTIA, WFMC, WTAM, and WTIM is also available on the SEC's website at adviserinfo.sec.gov. 
Private Banking is the marketing name for an offering of M&T Bank deposit and loan products and services.
M&T Bank  Equal Housing Lender. Bank NMLS #381076. Member FDIC. 
Investment and Insurance Products   • Are NOT Deposits  • Are NOT FDIC Insured  • Are NOT Insured By Any Federal Government Agency  • Have NO Bank Guarantee  • May Go Down In Value  
Investing involves risks and you may incur a profit or a loss. Past performance cannot guarantee future results. This material is provided for informational purposes only and is not intended as an offer or solicitation for the sale of any security or service. It is not designed or intended to provide financial, tax, legal, accounting, or other professional advice since such advice always requires consideration of individual circumstances. There is no assurance that any investment, financial or estate planning strategy will be successful.

For more than three years, repayment of federal student loans has been halted in response to the economic fallout stemming from the Covid-19 pandemic. Loan payments were initially paused by the Department of Education under the Trump administration and later extended once the Biden administration entered the White House. Now, after attempts by the current administration to provide permanent relief were struck down by the Supreme Court, federal student loan repayments are set to restart in October. This could add an additional headwind to a consumer already starting to show some signs of running out of steam, though the resumption of student debt payments is not considered a significant enough risk in and of itself to derail the economy. We maintain a conservative positioning in portfolios given heightened economic uncertainty and an unattractive risk versus reward profile for stocks.

Background

Covid-related student debt relief began in March 2020 and is since estimated to have forestalled over 20 million borrowers a total of $7.5 billion per month in payments.[1] The student loan payment pause is now scheduled to come to an end as part of the hotly contested debt ceiling deal,[2] which eventually reached a bipartisan agreement and was signed into law on June 3. Following passage of the deal, the Biden administration pushed to introduce programs that would have cancelled an estimated $430 billion in student debt.[3] The details of Biden’s debt relief program included benefits to individuals whose annual income was below $125,000 (or $250,000 for married couples). Pell Grant recipients below the income threshold would have had up to $20,000 forgiven, while non-Pell Grant recipients would have been eligible for up to $10,000 in debt relief.

In June, by a vote of 6 to 3, the Supreme Court struck down President Biden’s debt cancellation plan, stating that the administration had overstepped its authority in authorizing loan forgiveness under the HEROES Act. The High Court’s decision brings student loan forbearance to an end August 31 with interest on payments set to begin accruing immediately afterward. In addition, borrowers will be required to resume making payments starting in October. The resumption of student loan payments raises questions about the ability of millions of borrowers to repay their loans, the resiliency of consumers’ discretionary spending, and the potential impacts on the growth of the U.S. economy as this significant measure of pandemic-era fiscal support comes to an end.

At the onset of the pandemic, there were roughly 43 million federal student debt borrowers, or 17% of the U.S.’s adult population, with outstanding federal student loans totaling $1.64 trillion.[4] It’s estimated that 20 million borrowers, or nearly half, who were repaying loans in 2020 have moved into forbearance with an average debt balance of around $38,000.[5] As the restart of federal loan payments rapidly approaches, there may be sizeable parts of the population that are either unable or unwilling to resume payments.

According to 2022 data from the Federal Reserve Bank of Philadelphia, approximately 20% of current borrowers were expected to be unable to make any payments on student loans if forbearance ended.[6] It’s possible that strong wage growth and tight labor markets over the past year may have helped many of these borrowers achieve stronger financial footing. However, a different, more recent survey from Intuit showed that closer to 45% of student loan borrowers now expect to go delinquent on their payments.[7]

Efforts have been made to mitigate the upcoming economic impact. The Department of Education has responded with forms of relief for borrowers who have recently become unemployed or are able to prove financial hardship. Notably, the Biden administration instituted a one-year leniency program, which will shield borrowers from the consequences of not immediately resuming payments. The measure allows borrowers who don’t make payments from October 1, 2023, through September 30, 2024, to avoid being considered delinquent, being reported to credit bureaus, or being placed in default. Additionally, the Department of Education announced new rules for income-driven repayment (IDR) plans, which provide a path to lower payments based on income. There are currently four IDRs offered by the government, all of which are similar in nature, capping student loan payments to between 10%–20% of discretionary income and forgiving the remaining balance after 20–25 years of payments (depending upon income level). Other features of the IDRs include increasing income exemptions to 225% (from 150%) of the poverty guideline when determining loan payments. This means that a single borrower making less than $32,800 a year wouldn’t be required to make any student loan payments.

Also getting the attention of investors was a larger-than-anticipated federal budget deficit of $221 billion reported in July. The upside surprise was driven in part by a $71 billion increase in outlays for the newly revised IDRs, as well as tax revenue that came in 10% lower than last year.[8] The July deficit brought the fiscal year-to-date deficit to $1.61 trillion, more than double the $726 billion deficit reported for the same period last year. 

Economic impact

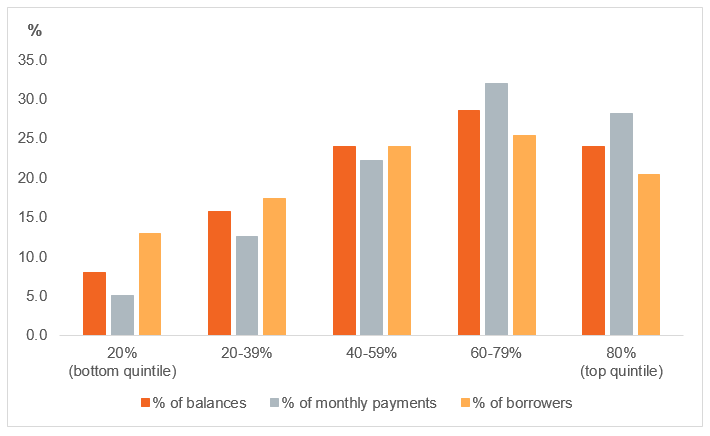
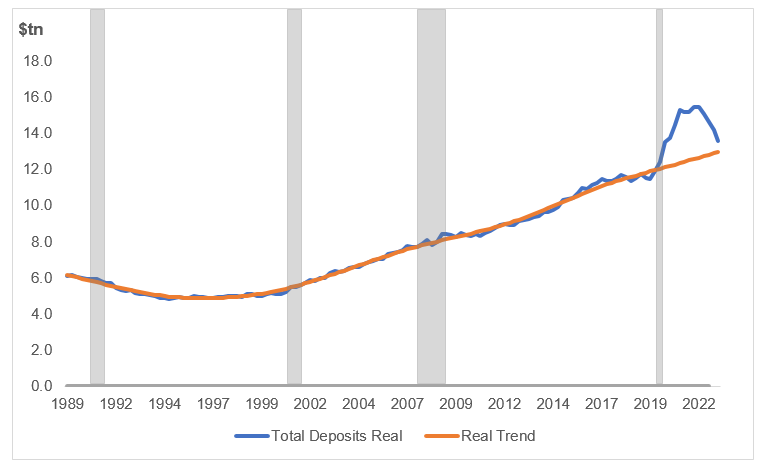
Although households at all income levels hold student debt, there are structural factors that could limit the impact of the payment restart. Student loan balances skew toward higher-income households, potentially providing them more flexibility to absorb payment resumption (Figure 1). The top two income quintiles, equating to those who make over $120,000 a year before taxes, account for about 46% of student loan borrowers and made over 60% of debt payments prior to forbearance.[9] Additionally, middle- and upper-income households still have elevated savings levels, which they should be able to draw down to make payments. By our estimates, total household excess savings is approximately $640 billion above the prepandemic trend, though this figure has declined precipitously from peak levels of around $3 trillion, as consumers continue to spend down their cash piles (Figure 2).

Figure 1: Households in the upper- and middle-income quintiles account for most of student loans

Distribution of student loans by income quintile (U.S.)

The mantra from the Fed was rates need to be well into “restrictive territory,” meaning above its estimate of the neutral rate of 2.5%

Figure represents 2019 (prepandemic) distribution data. Sources: Oxford Economics, Federal Reserve.

Figure 2: Consumers spend down cash pile, but it remains elevated to prepandemic trend

Total household deposits through 1Q 2023

Data as of March 31, 2023. Sources: Federal Reserve DFA data, WTIA.

As forbearance ends, borrowers may have to prioritize certain debt payments. According to the Intuit survey referenced above, about 40% of borrowers say paying down credit card debt will take a lower priority compared to making student loan payments. This comes as American credit card balances surged by $45 billion (or 4.6% q/q) in 1Q 2023, reaching an all-time high of $1.03 trillion (though not yet back to prior peaks once adjusting for household income).[10] Additionally, the average interest rate on consumer credit cards has spiked to 22%, up from around 16% in March of last year. Higher rent and mortgage payments also pose another challenge to U.S. households and could skew risks to the downside as the national average for a 30-year mortgage is now north of 7.0%, equivalent to the highest level in over 20 years.[11] Compared with other debt categories, credit cards saw the most pronounced increase in delinquencies last quarter, but the overall delinquency rates remain low after declining sharply since the beginning of the pandemic. Fortunately, while the total household debt service ratio has increased in recent quarters, it remains in line with its long-term median levels. A higher household debt service ratio indicates that debt payments consume a higher percent of disposable income for households, leading to reduced availability of discretionary spending (Figure 3). 

Figure 3: Consumers now have less discretionary income available for spending

U.S. Household Debt Service Ratio (Consumers, SA)

Data as of March 31, 2023. Sources: Federal Reserve, Bloomberg.

Market impact

For the markets, the impact remains to be seen but presents headwinds to consumer-facing or cyclical industries. It’s estimated that around half of student debt holders will owe month payments of over $200 per month, with around 20% of borrowers set to pay over $500 per month (Figure 4). The risk is that resumption of student payments requires consumers to curb spending on discretionary items or reduce payments to other forms of debt, the latter of which could have a detrimental impact over the next 12 months, given very high credit card and auto loan interest rates. Industries at risk of losing the greatest share of discretionary spending could include a wide range of retailers and e-commerce companies, casual dining chains, and entertainment services. On recent earnings calls, both Walmart and Target cited student loan repayments as part of the reason for their cautious outlook on demand for the remainder of the year.

Figure 4: Millions of Americans set to face new challenges with resumption of student loan payments

Distribution of student loan debt (monthly payments)

Data as of May 31, 2023. Sources: TransUnion U.S. consumer credit database, Bloomberg.

Fortunately, the consumer is holding up much better than many would have expected. The latest retail sales report topped forecasts and the prior two months were revised upward. The strong figure also reflected sales increases to sporting goods stores, clothing outlets, and restaurants and bars—all part of the discretionary spending category that is considered to be at risk. Companies are proceeding with caution, but student debt repayments are unlikely to derail economic growth, though it could provide another challenge for U.S. consumers who have demonstrated significant resilience over the last 12 months.

Core narrative

The recent slowing of inflation, healthy labor market, and continued strength of the consumer is encouraging. Our economic forecast has been upgraded in recent weeks, with slightly better odds of a soft landing versus a recession over the next 12 months. The main risk to the economy stems from the lagged effects of rapid monetary policy tightening, and resumption of student loan payments adds an additional headwind to a group of consumers that may begin to feel stretched as elevated borrowing costs take their toll. We are currently defensively positioned in portfolios with a modest underweight to equities across both international developed and U.S. small-cap asset classes, primarily due to elevated equity valuations and competition from safer assets. We hold an overweight to fixed income and cash (and are neutral versus our strategic benchmark across other asset classes).

Additional research provided by Asset Management intern Catie Meister.

[1] Source: Oxford Economics.

[2] https://www.cnbc.com/2023/06/01/student-loan-payment-pause-will-end-as-part-of-the-debt-ceiling-deal.html.

[3] Data as of June 30, 2023. Detailed in Supreme Court ruling: Biden v. Nebraska.

[4] Data as of December 2022. Source: Congressional Research Service.

[5] Data as of September 2021. Sources: Peter G. Peterson Foundation, Education Data Initiative.

[6] Data as of May 2022. Source: Federal Reserve Bank of Philadelphia.

[7] Data as of August 2023. Source: Intuit.

[8] Data as of July 2023. Source: U.S. Treasury. 

[9] U.S. household income data as of November 2022. Source: Congressional Budget Office. Distribution data as of December 2019. Sources: Oxford Economics, Federal Reserve.

[10] Data as of May 31, 2023. Sources: Federal Reserve, Bloomberg.

[11] Data as of August 17, 2023. Source: Freddie Mac.

Facts and views presented in this report have not been reviewed by, and may not reflect information known to, professionals in other business areas of Wilmington Trust or M&T Bank who may provide or seek to provide financial services to entities referred to in this report. M&T Bank and Wilmington Trust have established information barriers between their various business groups. As a result, M&T Bank and Wilmington Trust do not disclose certain client relationships with, or compensation received from, such entities in their reports.

The information on Wilmington Wire has been obtained from sources believed to be reliable, but its accuracy and completeness are not guaranteed. The opinions, estimates, and projections constitute the judgment of Wilmington Trust and are subject to change without notice. This commentary is for informational purposes only and is not intended as an offer or solicitation for the sale of any financial product or service or a recommendation or determination that any investment strategy is suitable for a specific investor. Investors should seek financial advice regarding the suitability of any investment strategy based on the investor’s objectives, financial situation, and particular needs. Diversification does not ensure a profit or guarantee against a loss. There is no assurance that any investment strategy will succeed.

Past performance cannot guarantee future results. Investing involves risk and you may incur a profit or a loss.

Indexes are not available for direct investment. Investment in a security or strategy designed to replicate the performance of an index will incur expenses such as management fees and transaction costs which will reduce returns.

Reference to the company names mentioned in this blog is merely for explaining the market view and should not be construed as investment advice or investment recommendations of those companies. Third party trademarks and brands are the property of their respective owners.

The gold industry can be significantly affected by international monetary and political developments as well as supply and demand for gold and operational costs associated with mining.


Stay Informed

Subscribe

Sign up here to receive insights designed to help you succeed.

Sign Up Now

WTU Newsletter Card
WTU Newsletter Handler