© 2024 M&T Bank and its affiliates and subsidiaries. All rights reserved.
Wilmington Trust is a registered service mark used in connection with various fiduciary and non-fiduciary services offered by certain subsidiaries of M&T Bank Corporation including, but not limited to, Manufacturers & Traders Trust Company (M&T Bank), Wilmington Trust Company (WTC) operating in Delaware only, Wilmington Trust, N.A. (WTNA), Wilmington Trust Investment Advisors, Inc. (WTIA), Wilmington Funds Management Corporation (WFMC), Wilmington Trust Asset Management, LLC (WTAM), and Wilmington Trust Investment Management, LLC (WTIM). Such services include trustee, custodial, agency, investment management, and other services. International corporate and institutional services are offered through M&T Bank Corporation’s international subsidiaries. Loans, credit cards, retail and business deposits, and other business and personal banking services and products are offered by M&T Bank. Member, FDIC. 
M&T Bank Corporation’s European subsidiaries (Wilmington Trust (UK) Limited, Wilmington Trust (London) Limited, Wilmington Trust SP Services (London) Limited, Wilmington Trust SP Services (Dublin) Limited, Wilmington Trust SP Services (Frankfurt) GmbH and Wilmington Trust SAS) provide international corporate and institutional services.
WTIA, WFMC, WTAM, and WTIM are investment advisors registered with the U.S. Securities and Exchange Commission (SEC). Registration with the SEC does not imply any level of skill or training. Additional Information about WTIA, WFMC, WTAM, and WTIM is also available on the SEC's website at adviserinfo.sec.gov. 
Private Banking is the marketing name for an offering of M&T Bank deposit and loan products and services.
M&T Bank  Equal Housing Lender. Bank NMLS #381076. Member FDIC. 
Investment and Insurance Products   • Are NOT Deposits  • Are NOT FDIC Insured  • Are NOT Insured By Any Federal Government Agency  • Have NO Bank Guarantee  • May Go Down In Value  
Investing involves risks and you may incur a profit or a loss. Past performance cannot guarantee future results. This material is provided for informational purposes only and is not intended as an offer or solicitation for the sale of any security or service. It is not designed or intended to provide financial, tax, legal, accounting, or other professional advice since such advice always requires consideration of individual circumstances. There is no assurance that any investment, financial or estate planning strategy will be successful.

The first quarter ended with a bang, but the second quarter has started with a whimper. Volatility has increased in the equity and fixed income markets. Investors are grappling with sticky inflation and a robust economy, a combination that threatens the Federal Reserve’s ability to cut interest rates. Our outlook remains one of optimism regarding a global economic recovery, synchronized central bank easing, and continued disinflation in the U.S. We see an opportunity in this shifting market narrative to lean into risk, and we are adding to equities in client portfolios. That increase in equities is being funded by a reduction in alternatives (liquid alternatives or traditional hedge funds).

Improving picture abroad

Despite some investor angst, we see an attractive setup in markets as we move through the second quarter. Starting with the international picture, global growth is finally showing signs of improving, particularly in Europe and Japan. After many months of sluggish economic data, a manufacturing recession, and languishing sentiment, green shoots are appearing in Europe. PMIs have bounced off of low levels (Figure 1), investor and consumer sentiment is recovering, and central banks look set to begin cutting rates in June.

Figure 1: Business activity rebounding in Europe

Composite Purchasing Manager Indices (PMIs) for Eurozone, UK

Data as of March 31, 2024. A reading above 50 indicates expansion, while a reading below 50 indicates contraction. Source: Bloomberg, S&P Global.

While the Bank of Japan is likely to move in the opposite direction as it increases rates, Japanese companies have shown an encouraging increase in profitability and return of capital to shareholders. Rounding out the more positive backdrop for international equities is the possibility that a reversal of recent dollar strength could add to U.S.-dollar based returns of international equities, should our Fed call prove correct. (More on our Fed views below.) Relative valuations of international developed versus U.S. equities offer an attractive opportunity to neutralize our underweight in this asset class.

Challenging consensus on the U.S. economy, Fed

The picture in the U.S. has been muddied by three months of disappointing inflation data and hawkish rhetoric from the Fed. This has caused the market to remove about five rate cuts from the 2024 forecast since the start of the year, sending the 10-year Treasury yield to the highest level since November (Figure 2). After advancing just 2% annualized in the second half of last year, core PCE jumped 3.7% to start 2024, raising the risk that disinflation is stalling, and the Fed may need to maintain the current policy rate for longer. Digging into the details reveals that recent inflation pressures are narrow, driven by a few categories—like shelter—which we expect to continue to slow. The consumer continues to spend, but we do not predict that the consumer will be strong enough to lead to a reacceleration of inflation pressures or “stickiness” for an extended period.

Figure 2: Inflation spooking rates market

10-year U.S. Treasury Yield

Data as of April 26, 2024. Source: Bloomberg.

Our economics team forecasts U.S. economic growth to slow from 3.4% GDP growth in the fourth quarter to a more trend-like rate of growth of just under 2% for calendar year 2024. Our growth and inflation expectations mean that starting in the second half of this year, the Fed should have more cover to begin normalizing monetary policy than they appear to have today. Holding rates where they are as growth and inflation slow poses the risk of passively over-tightening policy, something that could lead to a policy mistake (i.e., recession). While a lot of ink is spilled over the number of rate cuts expected in any given calendar year (we have revised our outlook to expect three cuts in 2024), we think the more important point is that the Fed will likely be able to begin easing rates by July as part of a steady, gradual normalization of policy eventually back to a neutral policy rate in a range of 2.5-3%.

Attractive opportunity in U.S. large cap

The current volatility provides some interesting optionality for investors, a key reason we are adding to U.S. large-cap equities and taking the asset class to a slight overweight versus our benchmark. We view the risk of reaccelerating inflation or “stagflation” (high inflation and low or negative economic growth) as very small given a continued, gradual easing of labor costs. Therefore, we do not consider the Fed hiking rates further as a realistic possibility. That leaves two scenarios with the highest likelihoods as it relates to the Fed’s policy path.

If the Fed keeps rates where they are for an extended period of time, it is likely because inflation has stalled out around current levels—which, in truth, are really only moderately above their target—and economic activity has continued to surprise to the upside. In this scenario, we think strong economic growth outweighs the Fed’s policy headwinds and supports corporate earnings. Historically, equities have performed well in a period of moderate inflation and strong growth. In a strong economy, companies usually have the ability to pass through cost increases to maintain margins. The last few earnings seasons have shown a nice recovery in operating margins. (Of course, holding rates elevated for a prolonged period of time increases the risk of a policy mistake and recession down the road.) In this scenario we would favor larger, higher-quality companies with healthy balance sheets and strong pricing power. Large-cap equity valuations are far from a bargain today, but we think a strong economy and solid earnings prospects will continue to support current market multiples.

The second scenario, which is our base case, involves the Fed cutting rates in a “Goldilocks” economy. With the economy as robust as it is today, a recessionary slowdown in the next 9-12 months is a low probability. Even if the economy weakens more than we expect, the Fed has plenty of policy support to cut rates. Rate cuts would improve the liquidity backdrop, and a still-expanding economy would be cheered by the equity market. In this scenario, U.S. large cap and small cap could both perform well. Lower rates would support valuations of the mega-cap tech companies dominating U.S. large cap today, while easier borrowing conditions would provide relief to the more heavily indebted small-cap companies. We also continue to like the total return prospects for investment-grade fixed income, an asset class we hold at an overweight compared to our strategic benchmark. We would expect both scenarios to favor fixed income over hedge funds, which is why we chose the latter as our funding source for our modest equity overweight.

Monitoring risks

Geopolitics remain a risk that we are monitoring. The most obvious signs of the market pricing geopolitical risk appear in the commodity complex, and we have seen oil and gold reacting to tensions in the Middle East. Contrary to how it may feel in the moment, most geopolitical conflicts do not end up being significant market-moving events of any lasting duration. At this time, we do not expect the conflict to spill over into the broader global economy.

The U.S. election is another major geopolitical risk event that will increasingly draw investor focus as we approach November. In the coming months we will provide more thoughts on how the policy platforms of the two candidates could create investment opportunities. For now, we will point out that, historically, elections have coincided with an increase in equity volatility leading up to the election. Once the veil of uncertainty has been lifted on election day, markets have usually breathed a sigh of relief and moved higher regardless of the party in power. Every time is different, and economic context is critical.

Core narrative

Near-term market volatility could remain elevated, but we think 9-12 months from now will reveal an equity market that has continued to hit new highs, likely with a few bumps along the way. We continue to expect inflation to slow, though not necessarily on a linear path. Inflation risks have pushed out our expectation of Fed cuts slightly, but we still think the Fed will have the ability to begin cutting rates early in the second half of the year. Even if the beginning of the Fed’s policy normalization is further delayed, economic growth is robust and supportive of corporate earnings. We see the current market weakness as an opportunity to establish an overweight to equities, favoring the U.S., while retaining a slight overweight to investment-grade fixed income (Figure 3).

Figure 3: Taking equities to a slight overweight

Current positioning versus the strategic asset allocation (Growth & Income risk profile)

Data as of April 23, 2024. Positioning reflects our monthly tactical asset allocation (TAA) versus the long-term strategic asset allocation (SAA) benchmark. For an overview of our asset allocation strategies, please see the disclosures.

*Private markets are only available to investors that meet Securities and Exchange Commission standards and are qualified and accredited. We recommend a strategic allocation to private markets we do not tactically adjust this asset class. 

Disclosures

Facts and views presented in this report have not been reviewed by, and may not reflect information known to, professionals in other business areas of Wilmington Trust or M&T Bank who may provide or seek to provide financial services to entities referred to in this report. M&T Bank and Wilmington Trust have established information barriers between their various business groups. As a result, M&T Bank and Wilmington Trust do not disclose certain client relationships with, or compensation received from, such entities in their reports.

The information on Wilmington Wire has been obtained from sources believed to be reliable, but its accuracy and completeness are not guaranteed. The opinions, estimates, and projections constitute the judgment of Wilmington Trust and are subject to change without notice. This commentary is for informational purposes only and is not intended as an offer or solicitation for the sale of any financial product or service or a recommendation or determination that any investment strategy is suitable for a specific investor. Investors should seek financial advice regarding the suitability of any investment strategy based on the investor’s objectives, financial situation, and particular needs. Diversification does not ensure a profit or guarantee against a loss. There is no assurance that any investment strategy will succeed.

Past performance cannot guarantee future results. Investing involves risk and you may incur a profit or a loss.

Indexes are not available for direct investment. Investment in a security or strategy designed to replicate the performance of an index will incur expenses such as management fees and transaction costs which will reduce returns.

Reference to the company names mentioned in this blog is merely for explaining the market view and should not be construed as investment advice or investment recommendations of those companies. Third party trademarks and brands are the property of their respective owners.

Any investment products discussed in this commentary are not insured by the FDIC or any other governmental agency, are not deposits of or other obligations of or guaranteed by M&T Bank, Wilmington Trust, or any other bank or entity, and are subject to risks, including a possible loss of the principal amount invested.

Some investment products may be available only to certain “qualified investors”—that is, investors who meet certain income and/or investable assets thresholds.

Alternative assets, such as strategies that invest in hedge funds, can present greater risk and are not suitable for all investors. 

Any positioning information provided does not include all positions that were taken in client accounts and may not be representative of current positioning. It should not be assumed that the positions described are or will be profitable or that positions taken in the future will be profitable or will equal the performance of those described.

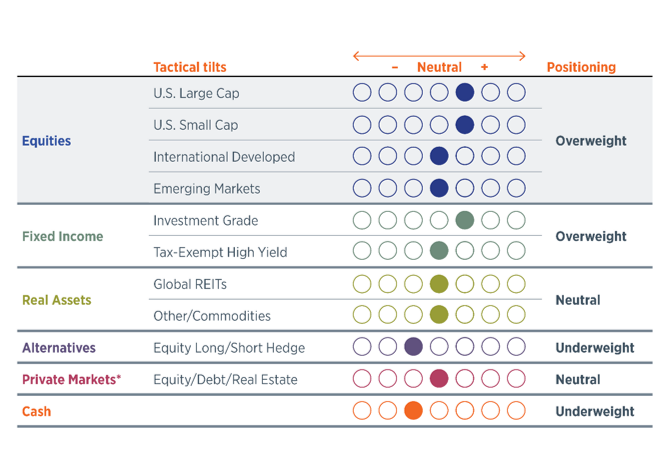
Wilmington Trust offers seven asset allocation models for taxable (high-net-worth) and tax-exempt (institutional) investors across five strategies reflecting a range of investment objectives and risk tolerances: Aggressive, Growth, Growth & Income, Income & Growth, and Conservative. The seven models are High-Net- Worth (HNW), HNW with Liquid Alternatives, HNW with Private Markets, HNW Tax Advantaged, Institutional, Institutional with Hedge LP, and Institutional with Private Markets. As the names imply, the strategies vary with the type and degree of exposure to hedge strategies and private market exposure, as well as with the focus on taxable or tax-exempt income.

Model Strategies may include exposure to the following asset classes: U.S. large-capitalization stocks, U.S. small-cap stocks, developed international stocks, emerging market stocks, U.S. and international real asset securities (including inflation-linked bonds and commodity-related and real estate-related securities), U.S. and international investment-grade bonds (corporate for Institutional or Tax Advantaged, municipal for other HNW), U.S. and international speculative grade (high-yield) corporate bonds and floating-rate notes, emerging markets debt, and cash equivalents. Model Strategies employing nontraditional hedge and private market investments will, naturally, carry those exposures as well. Each asset class carries a distinct set of risks, which should be reviewed and understood prior to investing.

Allocations: Each strategy group is constructed with target policy weights for each asset class. Wilmington Trust periodically adjusts the policy weights’ target allocations and may shift from the target allocations within certain ranges. Such tactical allocation adjustments are generally considered on a monthly basis in response to market conditions.

The asset classes and their current proxies are: • Large–cap U.S. stocks: Russell 1000® Index • Small–cap U.S. stocks: Russell 2000® Index • Developed international stocks: MSCI EAFE® (Net) Index • Emerging market stocks: MSCI Emerging Markets Index • U.S. inflation-linked bonds: Bloomberg US Treasury Inflation Notes TR Index Value Unhedged* • International inflation-linked bonds: Bloomberg World ex US ILB (Hedged) Index • Commodity-related securities: Bloomberg Commodity Index • U.S. REITs: S&P US REIT Index • International REITs: Dow Jones Global ex US Select RESI Index • Private markets: S&P Listed Private Equity Index • Hedge funds: HFRX Global Hedge Fund Index • U.S. taxable, investment-grade bonds: Bloomberg U.S. Aggregate Index • U.S. high-yield corporate bonds: Bloomberg U.S. Corporate High Yield Index • U.S. municipal, investment-grade bonds: S&P Municipal Bond Index • U.S. municipal high-yield bonds: 60% Bloomberg High Yield Municipal Bond Index / 40% Municipal Bond Index • International taxable, investment-grade bonds: Bloomberg Global Aggregate ex US • Emerging bond markets: Bloomberg EM USD Aggregate • Cash equivalent: 30-day U.S. Treasury bill rate.

Index Descriptions

The Bloomberg U.S. Aggregate Index measures the performance of the entire U.S. market of taxable, fixed-rate, investment-grade bonds. Each issue in the index has at least one year left until maturity and an outstanding par value of at least $250 million.

The Bloomberg U.S. High Yield Corporate Index, formerly known as Lehman Brothers U.S. High Yield Corporate Index, measures the performance of taxable, fixed-rate bonds issued by industrial, utility, and financial companies and rated below investment grade. Each issue in the index has at least one year left until maturity and an outstanding par value of at least $150 million.

The Bloomberg World Government Inflation-Linked Bond (WGILB) Index measures the performance of investment grade, government inflation-linked debt from 12 different developed market countries.

Bloomberg Commodity Index measures the performance of 19 futures contracts on physical commodities.  As of the annual reweighting of the components, no related group of commodities (for example, energy, precious metals, livestock, and grains) may constitute more than 33% of the index and no single commodity may constitute less than 2% or more than 15% of the index.

The Dow Jones Global ex-U.S. Index is an equal-weighted stock index composed of the stocks of 150 top companies from around the world (excluding the U.S.) as selected by Dow Jones editors and based on the companies' long history of success and popularity among investors. The Global Dow is designed to reflect the global stock market and gives preferences to companies with global reach.

The HFRX Global Hedge Fund Index is designed to be representative of the overall composition of the hedge fund universe. It is composed of all eligible hedge fund strategies; including but not limited to convertible arbitrage, distressed securities, equity hedge, equity market neutral, event driven, macro, merger arbitrage, and relative value arbitrage. The strategies are asset weighted based on the distribution of assets in the hedge fund industry.

The MSCI All-Country World Index ex USA measures the performance of large- and mid-capitalization stocks in approximately 50 developed and emerging equity markets, excluding the United States.

The MSCI EAFE® (net) Index measures the performance of approximately 20 developed equity markets, excluding those of the United States and Canada. The total returns of the index are net of the maximum tax withholding rates that apply in many countries to dividends paid to nonresident investors. 

The MSCI Emerging Markets Index captures large- and mid-cap representation across 26 emerging markets countries. With 1,198 constituents, the index covers approximately 85% of the free-float-adjusted market capitalization in each country.

Russell 1000® Growth Index measures the performance of those Russell 1000 Index companies with higher price-to-book ratios and higher forecasted growth values.

Russell 1000® Value Index measures the performance of those Russell 1000 Index companies with lower price-to-book ratios and lower forecasted growth values.

The Russell 2000® Index measures the performance of the 2,000 smallest companies in the Russell 3000 Index, which represents approximately 8% of the total market capitalization of the Russell 3000 Index. As of its latest reconstitution, the index had a total market capitalization range of approximately $128 million to $1.3 billion.

The Russell 3000® Index measures the performance of the 3,000 largest U.S. companies based on total market capitalization, which represents approximately 98% of the investable U.S. equity market. As of its latest reconstitution, the index had a total market capitalization range of approximately $128 million to $309 billion.

The S&P 500 Index measures the performance of approximately 500 widely held common stocks listed on U.S. exchanges. Most of the stocks in the index are large-capitalization U.S. issues. The index accounts for roughly 75% of the total market capitalization of all U.S. equities.

The S&P Composite Stock Price Index (noted on slide 8) refers to the data series made popular in recent years by Yale Professor Robert Shiller, not to be confused with the S&P Composite 1500, an index that combines the S&P 500, the S&P Mid Cap 400, and the S&P Small Cap 600. Investing involves risks and you may incur a profit or a loss.

The S&P Developed Property defines and measures the investable universe of publicly traded property companies domiciled in developed markets.

The S&P Municipal Bond High-Yield Index consists of bonds in the S&P Municipal Bond Index that are not rated or are rated below investment grade.

The S&P Municipal Bond Index is a broad, market value-weighted index that seeks to measure the performance of the U.S. municipal bond market.

The S&P United States REIT Index measures the investable U.S. real estate investment trust market and maintains a constituency that reflects the market’s overall composition.


Stay Informed

Subscribe

Sign up here to receive insights designed to help you succeed.

Sign Up Now

WTU Newsletter Card
WTU Newsletter Handler