Equal Housing Lender. © 2026 M&T Bank and its affiliates and subsidiaries. NMLS #381076. M&T Bank Member FDIC.
Institutional Services Insights
Wealth Management Insights
Who We Are
Log In
Select Business Area
Our Services
Institutional Services Insights
As we make the turn for the final lap of the calendar year, we are struck by the bifurcated nature of the economy. More so than usual, beauty is in the eye of the beholder, and one’s view of economic prospects is a function of perspective.
For example, those in the business of building out Artificial Intelligence (AI) are in the midst of a veritable construction boom, while capex outside of AI is muted at best. Similarly, high-income consumers are thriving, while low-income consumers are feeling the weight of higher interest rates and declining real wages. Relatedly, owners of capital continue to win, while the labor share of the economy is partaking in less of the upside.
Our view of the economy and markets reflects a culmination of the data, as well as many conversations we have with business owners and consumers across the country. Our conclusion is that, despite some bumps in the road, the economy is in on solid footing: not too hot as to exert upward pressure on inflation, and not too cold that we are concerned about stagnation or recession. We expect equities could exhibit volatility in the coming months but expect the resilience of the economy to serve financial markets well over the next year, warranting a continued overweight to equities across U.S. large cap, U.S. small cap, and emerging markets.
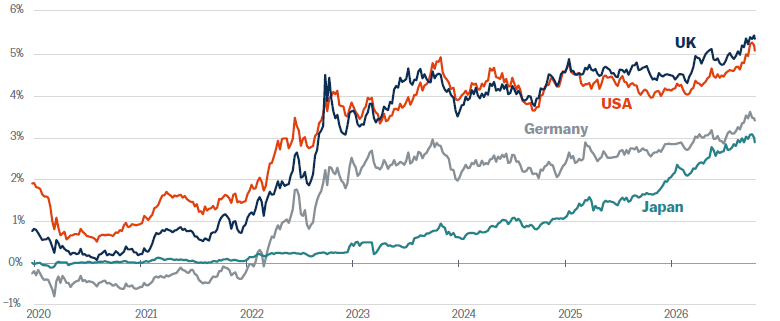
The most consequential change in markets since the start of 2026, and especially over the last 3 months, was the violent move in interest rates (Figure 1). The 10-year U.S. Treasury yield began the year at 4.16%. At the end of September it stood at 5.28%, with more than three quarters of that move occurring in the last three months. Rates moved higher across the curve, with the short end of the curve reacting to the market pricing in an effective federal funds rate of 4.9% a year from now.1 Meanwhile, the 30-year Treasury yield hit a 22-year high as fiscal concerns, AI-related debt issuance, energy-driven inflation and a global bond selloff took hold. We discussed the drivers of rates in a recent Wilmington Wire post.
Figure 1: Global rates on the move
10-year government bond yields
Sources: Bloomberg, Wilmington Trust. Data through October 15, 2026.
In the first couple weeks of October, long rates have come off the boil, as yields start to look attractive, particularly in the face of AI-related equity volatility (more on this in a moment). But the short end of the curve continues to bleed higher in the face of inflation fears. September’s Consumer Price Index (CPI) and Producer Price Index (PPI) both came in hotter than expected due to higher energy prices.
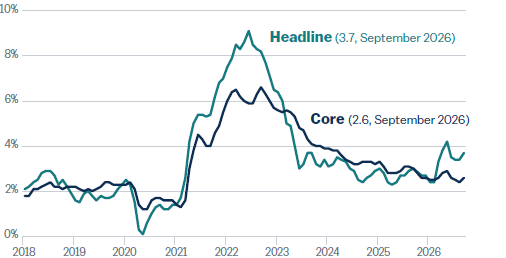
However, the Fed can do nothing to bring down energy prices, which is why they focus on core inflation (stripping out food and energy). Core CPI at 2.6% y/y (Figure 2) is much closer to the Fed’s target,2 and outside of some narrow energy passthrough (jet fuel’s impact on airfares), AI impact (chip companies prioritizing data centers over consumer electronics, leading to shortages), and lingering tariff impacts (toy prices were up on the month), we see little evidence that inflation is on the upswing. Housing, a large component of inflation, is feeling the weight of 7.5% mortgage rates, and home sellers outpaced buyers nationwide by the widest margin since at least 2013.3 (Markets in the northeast remain tighter than others like the sun belt and west.) This suggests housing is not a concern for inflation in the near term.
Figure 2: Core CPI around the Fed's target
Headline and Core CPI y/y (%)
Sources: Bureau of Labor Statistics, Wilmington Trust. Data as of September 2026.
The key question for the Fed is whether inflation is being generated by a strong consumer able and willing to accept ever-higher prices of goods and services. In this case, we think the answer is no. In fact, outside of gasoline-related purchases, September’s retail sales growth figure was just barely positive, and that is before removing the impact of inflation. This signals to us that the consumer is already slowing, diverting purchases from discretionary items to essentials like food, gasoline, and utilities.
Of course, the Fed may be looking through a slightly different lens. In the court of public opinion, they have arguably failed on their inflation objective for the past five years. There is no end in sight to the wars creating the oil supply shock, and the longer that lasts, the more likely it is that higher transportation costs are passed through into goods. The current and former chairs of the Federal Reserve have also made it clear that, while the Fed is governed by a dual mandate (price stability and full employment), you cannot have long-term health in the labor market without stable prices, and inflation is their priority. Their assessment of risk—both reputational and inflation-related—may lead them to raise rates again at the end of this year. While we do not think such a move is necessary, we believe economic conditions will have the Fed unwinding hikes next year as disinflation continues. The main risk to this view is a continuation of the Iran conflict that could drive energy prices significantly higher than the elevated level at which they already sit.
For its part, the U.S. equity market has weathered the move in rates fairly well, particularly given how quickly rates have moved across the curve in such a short amount of time. Earlier this year we pointed to the 5% threshold as a level that could induce more volatility into the equity market, yet the S&P 500 hit an all-time high on October 6. Several factors are at play to explain relatively low aggregate market volatility alongside the move in rates.
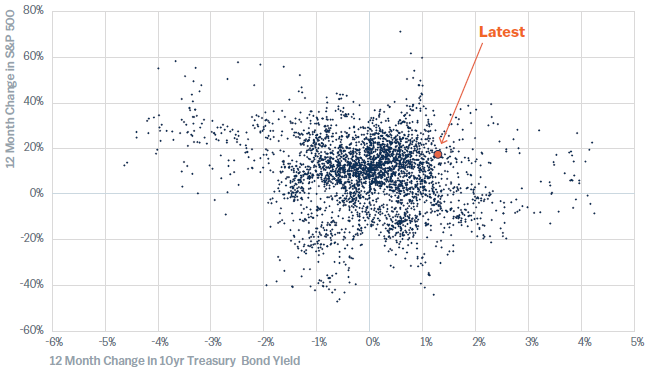
First, it is worth noting that interest rates do not have as strong a relationship with equity prices as you may think. Magnitude, duration, and reason for the move in rates all provide critical context (Figure 3).
Figure 3: An imperfect relationship between rates and equities
12-month change in S&P 500 vs. 12-month change in yields
Sources: Bloomberg, Wilmington Trust. Data as of October 15, 2026. Investing involves risks, and you may incur a profit or a loss. Past performance cannot guarantee future results. Short-term performance may not be indicative of long-term results.
In this case, one of the biggest engines of growth for earnings and the economy—the AI infrastructure buildout—has not been particularly rate sensitive. However, the market has been punishing some of the more prolific borrowers of late, including smaller, faster growing neocloud companies (providers of AI computing power and data centers who focus more exclusively in the space than the more diversified hyperscalers). Credit default spreads are widening in investment-grade and high-yield fixed income, but not yet to levels that look concerning. We still see hyperscaler debt profiles as reasonable, borrowing costs for the largest and most diversified companies are still relatively low, making debt issuance an attractive funding source for investment.
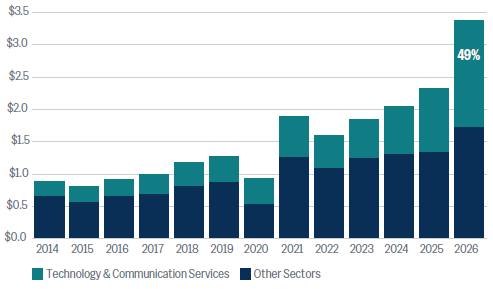
Another reason for market resilience is that earnings have been remarkably strong, on par with the type of earnings growth typically seen coming out of a recession. Earnings growth for the S&P 500 will likely exceed 30% for 2026, with AI being a strong driver but solid earnings from cyclical and non-tech sectors, as well (Figure 4).
Figure 4: Nearly half of S&P 500 earnings come from technology
S&P 500 earnings
Sources: Bloomberg, Wilmington Trust. 2026 figure blends reported data with full year estimates. Data as of September 30, 2026.
While the S&P 500 has exhibited low volatility at the index level and made a new all-time high in early October, there is more undulation under the surface. Only about half of companies are trading above their 200-day moving average. Tech is one of the best performing sectors over the last month, and leadership skewed toward the index heavyweights for most of the summer, yet the Philadelphia Semiconductor Index is 22% off its June highs.
Small cap equities have experienced more pain than large cap and are trading at the lowest level relative to large cap since the end of 2025, as consumer sentiment and higher rates weigh on the more economically-sensitive parts of the market. For the most part, though, capital has been rotating within the market, rather than leaving the equity market altogether.
Valuations have taken a hit with the increase in rates, and we have seen the price-to-earnings ratio (based on projected earnings over the next 12 months) for the S&P 500 decline from 22.8x to 18.8x. Earnings have been so strong this year that their increase has far outstripped the price return of the market, and as just cited, equities are potentially cheaper today on a forward-looking earnings basis than they were at the start of the year.
War and midterm elections are the primary geopolitical risks to the market, and both appear manageable for now. Wars in Russia/Ukraine and the Middle East continue to exert upward supply on oil prices and refined products. Pressure is mounting on consumers and transportation companies as gasoline and diesel prices reach historic levels (in nominal dollars). Inventory drawdowns in the U.S. and globally have provided some cushion to the oil supply shock, and at current levels cannot continue. However, oil flow through the Middle East has stabilized at approximately 80-90% of pre-war levels as supplies are diverted around the Strait of Hormuz.
The midterm elections will, according to current polling, likely result in a shift in composition of leadership in Washington. Though, even in the case of a “blue sweep” in which Democrats take control of the House and Senate, under a Republican president this would still leave a divided government with little chance of material policy change. Lack of policy change in Washington could be a favorable scenario for markets, as markets tend to reward anything that provides more certainty. One area we have been watching is the increased politicization of AI, including pushback on data center construction, concern about AI taking jobs, and fears regarding security. This could become a greater headwind to the industry and AI buildout in 2027.
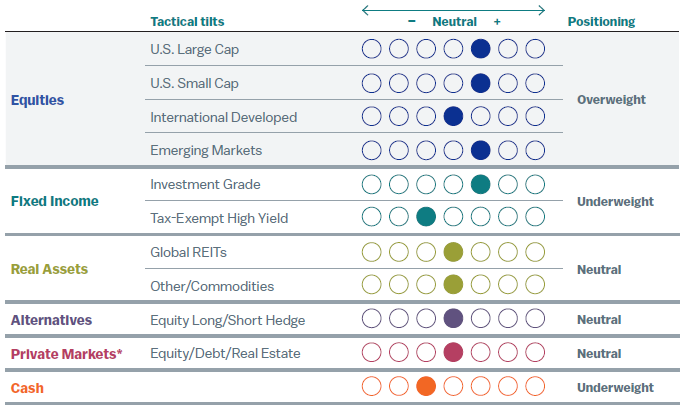
It is a complex environment in which to invest. Overall, we view the economy as being in a solid place and expect inflation to cooperate and allow the Fed to stop short of a full-fledged rate-hike cycle, possibly even easing financial conditions in 2027. Earnings growth has been incredibly strong, and even though it is forecast to slow in 2027, we expect it will continue to provide support to the market. Valuations for equities and fixed income have both become more attractive since the start of this year. There are downside risks, but there are also upside opportunities over the next 12 months, and we think investors are being compensated to take risk in equities, particularly in more attractively valued areas of tech and high-quality companies across sectors. We retain an overweight to equities across U.S. large cap, U.S. small cap, and emerging markets (Figure 5). In late September, we added a small amount to investment-grade fixed income from cash, seeing an opportunity with rates elevated to extend duration in portfolios. The road to 2027 could be bumpy in the short term, but we ultimately think smoother pavement lies ahead.
Figure 5: Portfolio positioning
High-net-worth portfolios with private markets*
Data as of September 30, 2026.
Positioning reflects our monthly tactical asset allocation (TAA) versus the long-term strategic asset allocation (SAA) benchmark.
For an overview of our asset allocation strategies, please see the disclosures.
*Private markets are only available to investors that meet Securities and Exchange Commission standards and are qualified and accredited.
We recommend a strategic allocation to private markets we do not tactically adjust this asset class.
Please see important disclosures at the end of the article.
1 At the recent peak on September 28, 2026, the fed funds futures market was pricing in a fed rate of 4.9% a year from now. Sources: Bloomberg, Wilmington Trust. Data as of September 28, 2026.
2 The Fed focuses more on the Personal Consumption Expenditures (PCE) Index, with a target of 2%. The CPI typically tracks the PCE but runs at an average of about 0.4% higher than the PCE, so a 2.4% y/y rate on the CPI roughly equates to the Fed’s target.
3 Redfin, Wall Street Journal, as of September 30, 2026.
Please complete the form below and one of our advisors will reach out to you.
* Indicates a required field.
Stay Informed
Subscribe
Ideas, analysis, and perspectives to help you make your next move with confidence.
What can we help you with today